Coronavirus Recovery Teams: Track Lockdowns and Shelter in Place Mandates with this New Feature

Shelter in place and lockdown restrictions have had a huge unprecedented impact worldwide that is likely to continue for some months. But because these restrictions vary by country, and in many cases, state by state, keeping track of the status of every lockdown and shelter-in-place in your relevant markets is near impossible to do manually.
Today we are pleased to announce a new feature that will allow our years to see lockdown or restriction events at both the country and the region or state level.
These are important to track for many reasons including:
Lockdown orders have created significant decremental demand for many businesses, while surges for some such as home delivery and e-commerce.
The lifting or easing of these lockdown or shelter-in-place orders will create an opportunity for pent-up demand that your team should be preparing for.
We are working closely with our customers on using real-world events effectively in their recovery strategies but we wanted to meet their immediate needs as quickly as possible. We know this demand intelligence is urgently needed because many of our customers have requested a way to track all these rules at scale, so they can know immediately when restrictions are increased, lightened or lifted. This would have immediate demand forecasting benefits, as well as making it possible for machine learning models to make sense of these changes without significant manual updating by data science teams.
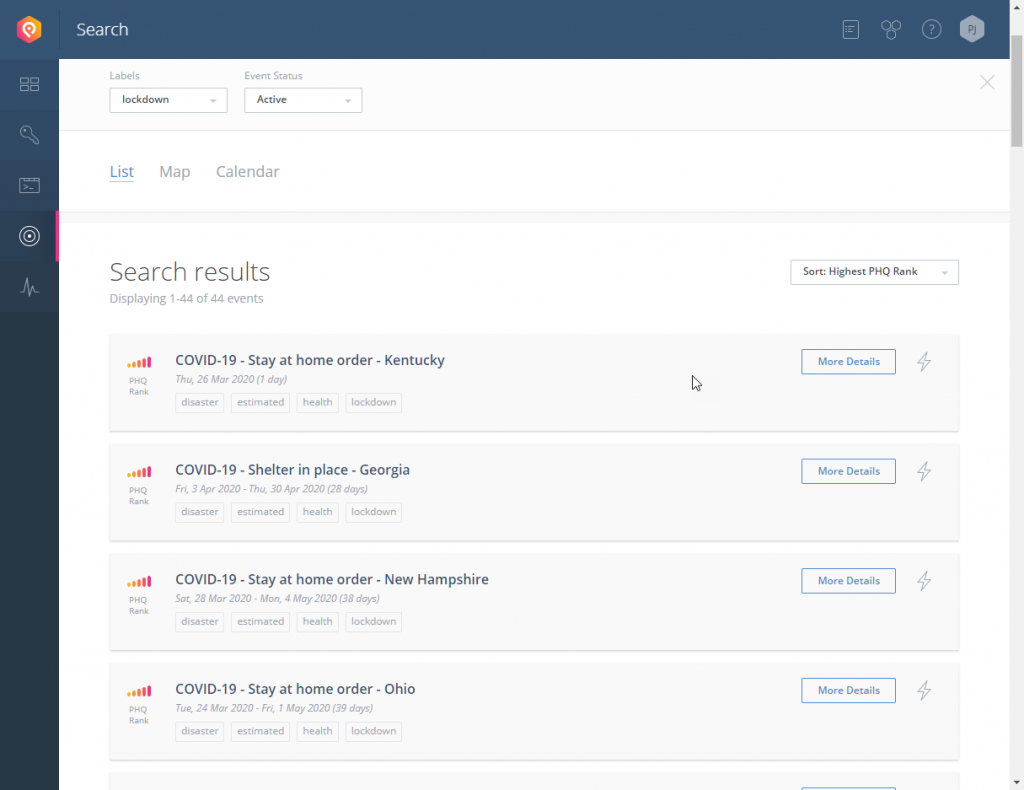
The shelter in place and lockdown events can be found in Control Center or via our demand intelligence API under the lockdown label as shown below:
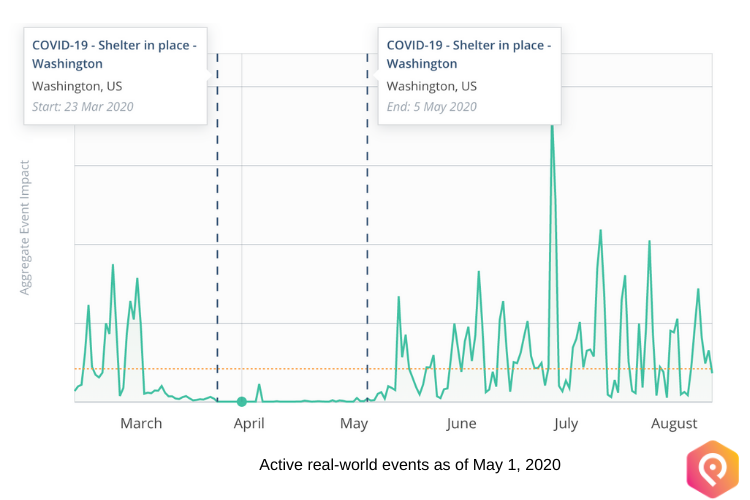
You can also view these events on a timescale with our Aggregate Event Impact tool. For example, here is the state of Washington’s lock down mandate:
There are two key ways to use this feature: informing your recovery strategy and creating more intelligent models for future major demand anomalies.
At the time of release we have lockdown and shelter in place events in our system for the United States and Europe. We will soon be expanding this out to other countries.
1. Inform your Coronavirus recovery strategy
Correlate the impact on your demand with restrictions across similar countries or states/regions to better understand their impact. Both the impact of their commencement and the easing of these restrictions will be powerful demand intelligence to inform your recovery strategy.
Having a standardized and verified source of this information will enable you to better track and manage this information. Whether you are creating COVID-19 and recovery dashboards or updating forecasting our data is available in our Control Center tool and via our demand intelligence API. You can use our API to incorporate our data programmatically or into your dashboards. You can also use Data Exporter or Tableau Connector to help utilize the data.
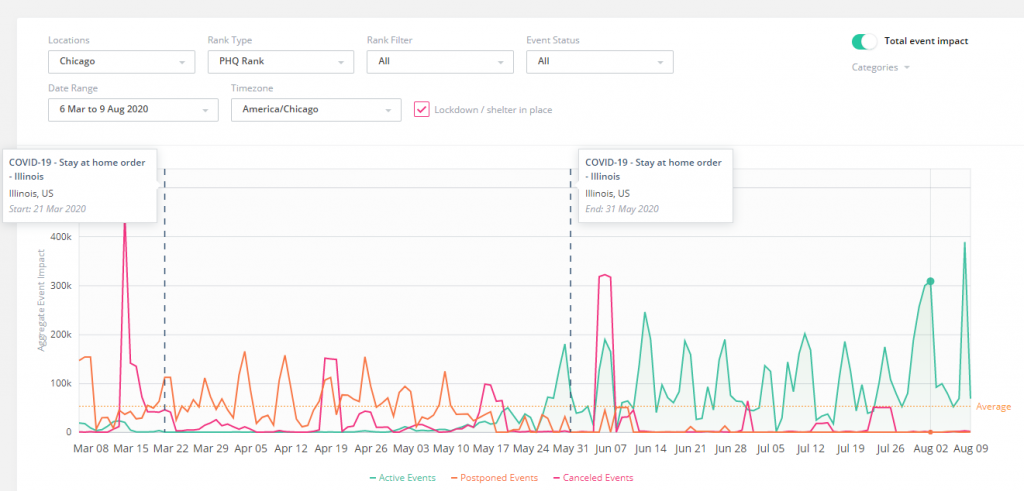
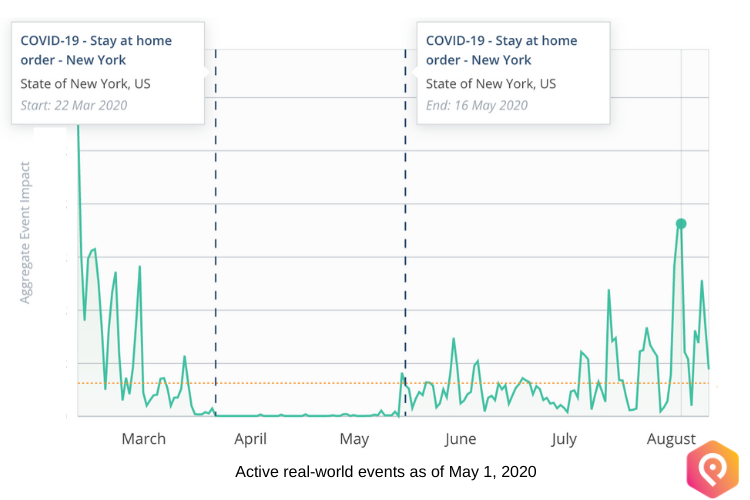
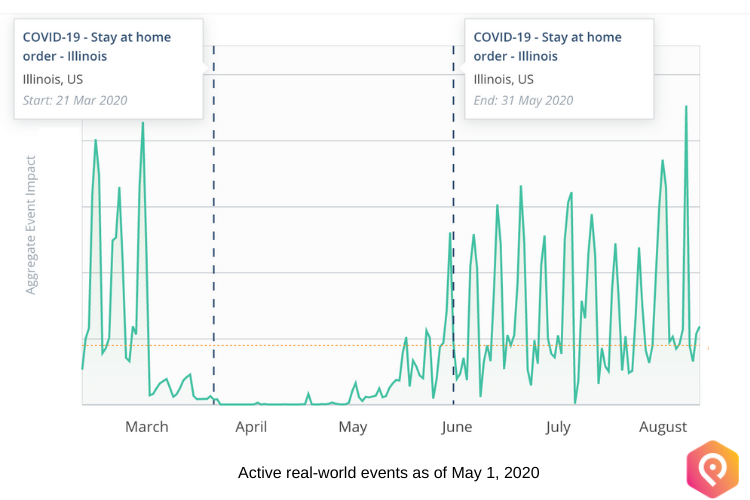
Restrictions and lockdowns are not uniform in severity or timing across locations so each will need its own data in your demand forecasting models for the recovery. For example, here are the active events in the state of New York and the state of Illinois.

If you were relying on New York’s dates for your entire US strategy, you’d waste weeks of stock and staff as the lockdown is scheduled to end later.
2. Create more intelligent machine learning models for predicting and adapting to future restrictions
While an almost global lockdown period is unlikely to occur again soon, shelter-in-place and similar restrictions are not as uncommon as many may imagine due to terrorism, severe weather and natural disasters.
By adding this feature into PredictHQ’s API of intelligent and verified event data, we have enabled our customers to begin to build models that can make sense of these events so they can approve their ability to bounce back efficiently and with minimal stress. This feature will also be useful for the coronavirus recovery teams that are overhauling their company’s demand planning processes in preparation.
How to use our lockdown and shelter in place feature
Data scientists and engineers can use this feature in our API and via our Data Exporter while non-technical users can access it through our Control Center search functionality.
Control Center
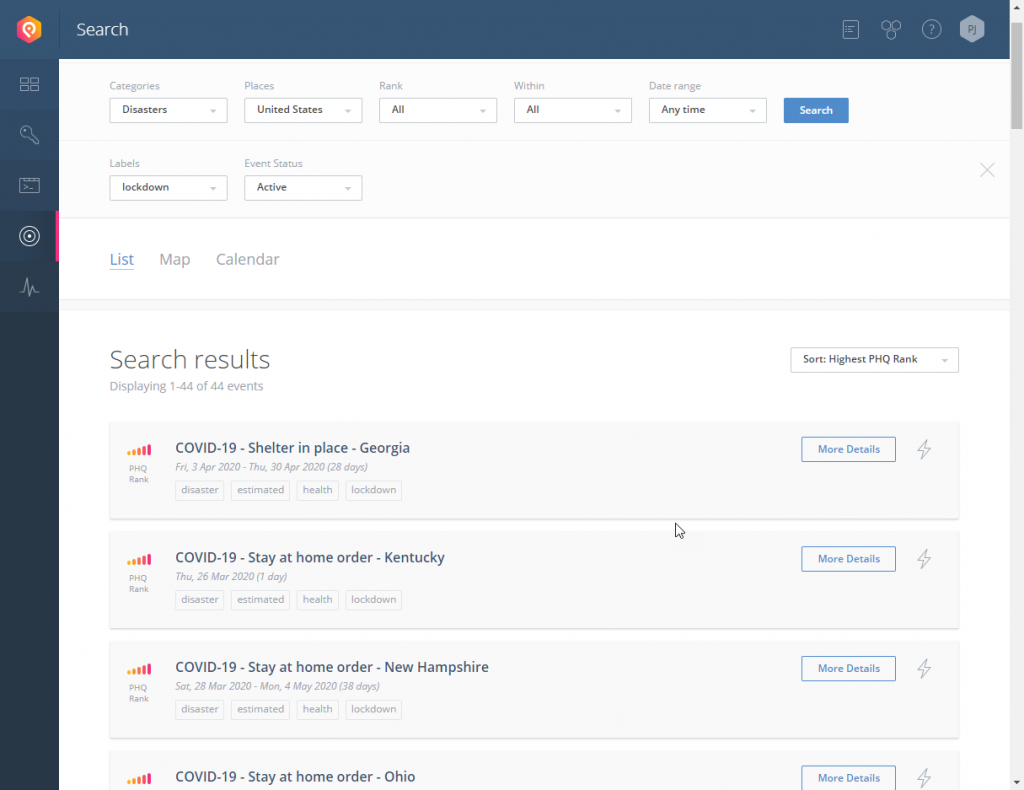
To find these events in Control Center, simply open up the search tab and:
Select the disasters category
Enter the term lockdown into labels to search, and then tick the ‘lockdown’ label – this covers lockdowns, shelter in place and stay at home orders
Select the country or state as the location
This will cause Control Center Search to display the relevant restrictions. We recommend leaving the Date Range feature blank or broad ie 2020 to ensure you capture all the relevant COVID-19 restrictions.
Note: we are storing both shelter in place and lockdown directives under this label.
How to get these events with our API
As in Control Center, you call the API and filter on the disasters category and the lockdown label. Then specify the country or state you want to see the lockdown events for. The example below retrieves all lockdown (and shelter in place) events that you have access to.
curl -X GET  https://api.predicthq.com/v1/events/?country=US&category=disasters&label=lockdown \
     -H "Accept: application/json"
     -H "Authorization: Bearer $ACCESS_TOKEN"
Aggregate Event Impact Graph
We also show lockdown and shelter in place warnings in our aggregate event impact graph in Control Center, as shown above with the graphs of New York, Washington and Illinois.
The graph shows you the total impact of events in a location per day. The shelter in place events show up on the graph as vertical lines showing the start and end dates (where known) of these directives. This provides our customers with more context on our event information and changes in demand.
Choose the location and time range in the graph to see shelter in place directives for different locations. These directives will show at the country, region or state level and at locations within the country and state.