Unlock Events to Transform Profitability: How Retail Companies use PredictHQ

The pandemic has driven a period of rapid and tumultuous change for retail and in particular food retail companies. It’s never been harder to accurately forecast demand for inventory and staff management, and it's also never been more competitive for every customer.
Now more than ever, the big challenge is accurate demand forecasting with out-of-stocks and overstocks costing retailers more than $1.1 trillion globally each year. Overestimating your demand leads to surplus staff, inventory gluts and waste. And underestimating demand means you lose customers due to out-of-stocks, long queues or stressed staff who just can’t give people the service they expect. For quick service or fast casual restaurants, you need to forecast well to ensure fast service and well produced orders.
The PredictHQ team works with some of the USA's largest QSR chains to understand the role events play in their demand. Events are major catalysts of demand but are also incredibly dynamic - especially these days - which makes them hard to track. We want to introduce you to some of the features we have crafted for the complexities of retail demand forecasting.
Smarter forecasting with demand intelligence for retail
Whether it’s global pizza empire Domino’s; a major global coffee retailer; a leading Australasian grocery chain with hundreds of outlets; or even an on-demand snack delivery service targeting young people, PredictHQ tracks 19 categories of events so your teams or models can plan with confidence.
These companies need to know:
Which events impact their demand, driving it up or down
When similar events are coming up
And how significant these events will be, whether that's how many people will be attending or how severe an unscheduled event such as a severe storm is.
This directly informs their inventory levels, workforce optimization, and pricing strategies. Events impact the strategies of bricks and mortar stores or chains that will be capitalizing on increased footfall, and delivery-based retail that will need to update their fleet and warehousing strategies also.
To provide the targeted demand intelligence these companies need, we have created features to make finding the most relevant events to their stores as easy as possible.
Find the closest events to your stores and warehouses with Radial Search
With the data processing pipeline, PredictHQ has identified and verified more than 20 million events. Each month, our systems identify another half a million or so, and verify and enrich them. That’s a lot of events – and not all will be relevant for your stores.
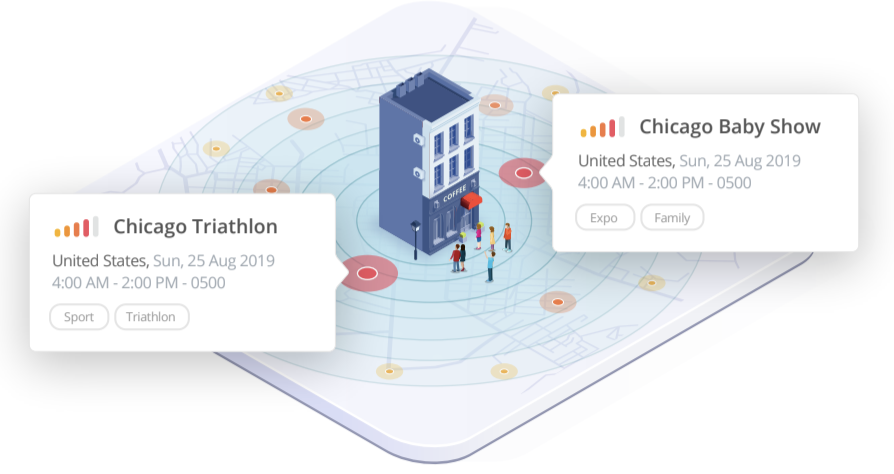
That’s where our Radial Search feature comes in. We built it for retailers to sort through our events to know which of your stores will be most affected.
Imagine you run a chain of coffee stores with multiple stores across 12 different cities. You will be able to identify all the events taking place in each city. But if you run a retail operation, more granular search functionality is needed. You need to understand the impact of proximity of both large and small events on each of your stores throughout each city.
For example, let's consider the impact of events on your San Francisco stores:
A major conference held at the Moscone Center in San Francisco will have more impact on your stores in the South of Market neighborhood closest to Moscone than those further away. As the largest conference center in San Francisco, the impact of key events held here may be felt more broadly but you can expect the largest demand to occur at the closest stores to the event itself.
Smaller local events can also have a significant impact on particular stores and are easy to miss if you’re not using Radial Search. For example, the Castro Farmers Market will be of significant interest to stores around the Castro area but few others. In the same way, the San Francisco’s annual Pier to Pier fun-runs will only be relevant to outlets along the route.
Once you know which events are closest to your cafes, you’ll be able to allocate the right amount of staff and stock to the stores set to receive additional demand. In many cases for retailers, re-allocating resources within your network both increases sales while minimizing waste.
To use Radial Search:
Use the location_around parameter of the PredictHQ API.
Specify the latitude and longitude of the store or location you are searching for and how far an event should be away before the relevance decreases (e.g. every half a mile or 1 mile).
The API will add the proximity of the event to the user’s location as a relevance component. This means events that are further away will have a lower relevance.
Sorting on relevance allows you to find the highest impact events that are close to individual stores.
See the Spatial Relevance section in PredictHQ’s relevance guide for more details.
Know which events matter most with Local Rank + PHQ Predicted Attendance
Even when you have sorted events by location or Radial Search, you can still turn up hundreds of events each month. PredictHQ has a unique set of models that accurately models the predicted attendance at events known as PHQ Predicted Attendance so your team and models can use this number to plan.
We also have unique ranking algorithms so you can identify which events will have the most impact to you.
PHQ Rank™ gives the potential impact of an event independent of its geographical location, therefore the most useful rank for most retailers is Local Rank™. Local Rank™ is PredictHQ’s rank for predicting the impact of an event on its particular location, such as the city or town where the event is being held.
Local Rank™ factors in an event’s location within a city or suburb, how built up an area is, its transport routes and many other factors. It quantifies the local impact an event of 10,000 people being held in the heart of a big city such as London would have, compared with the local impact a similar sized event would have if held in an outer suburb of London or a smaller town. Local Rank™ is a log scale numerical value between 0 and 100 to efficiently indicate the event’s estimated local impact.
To use Local Rank:
Filter and sort on the Local Rank™ value in your API calls to return those events with a higher local rank first. This helps you filter out larger city or region wide events that are further away from a store.
The relevance parameter is a powerful feature that allows you to specify multiple options that the API will use to dynamically calculate relevance in your search results.
In this example you can tell the API to use location_around and local_rank in relevance. This will mean both the distance from the store (radial search, mentioned above) and the local rank value will go into calculating relevance for the events returned in an API query.
You can then sort by relevance to find the events with a high local impact that are close to the store.
Uncovering Demand Surges in Advance
While the ranks are useful, retailers that only optimize for the largest or highest ranked events would be missing out. Because clusters of events creating demand surges are common and high-impact if you're prepared to make the most of them.
Perfect storms of demand are when small to medium sized events cluster to create major impact. It’s easy to know when the big events are coming, but the real competitive advantage comes from knowing when perfect storms of demand with similar or even greater impact are coming.
Identifying perfect storms of demand is impossible without PredictHQ’s ranked events and PHQ Predicted Attendance. Clusteres can be identified at the city or airport level, as well as around a particular geolocation. Using Local Rank and Radial Search, companies are able to spot these storms before they’re caught in the middle of them unprepared. Knowing they’re coming means you can have the right amount of staff and stock ready to go, while your competitors are flailing.
Global coverage across multiple categories
PredictHQ covers 19 categories of events across every country. These categories include concerts, sports games and conferences, right through to community events such as farmers markets, fun runs and key observances. We also provide live, breaking coverage of unscheduled events such as severe weather, natural disasters and terrorist attacks.
Which events are most relevant to a retail stores or warehouses varies widely, depending on their goods and target customers. For example:
School holidays are highly relevant to family-focused retailers and travel retailers, such as camping goods stores or food franchise chains that position themselves as family friendly. They’re less relevant to luxury fashion retailers.
Conferences and expos are highly relevant to fast moving consumer goods stores and restaurants close by key venues. But of little to no interest to baby clothing chains or meal kit providers.
Most religious observances are highly relevant to grocery stores and particular food stores and warehouses, but of limited importance to coffee chains.
Academic Events impact retailers with locations on or around college campuses. Knowing when final exams for the semester are coming is crucial to properly stock up on food and staff for coffee retailers for example.
Adding event visibility into your workflow
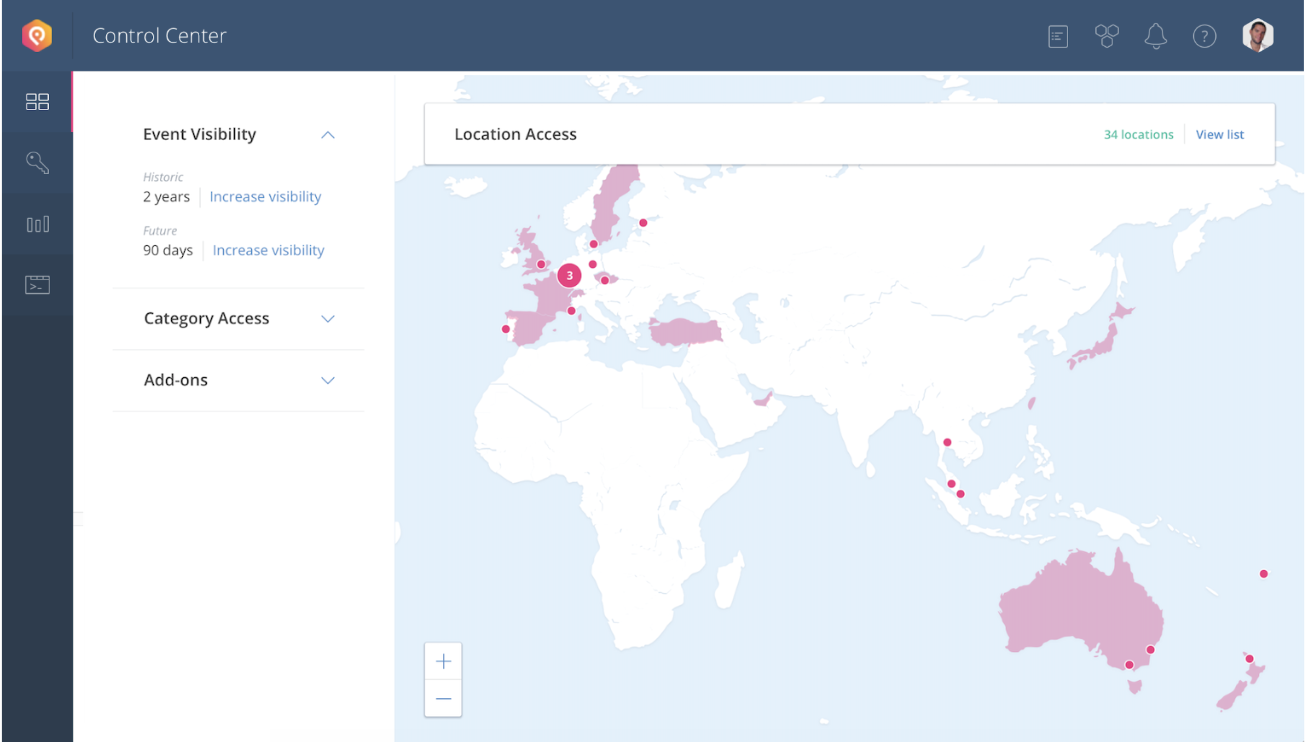
PredictHQ customers have visibility into which categories and cities they can currently access via our Control Center. From here, customers can also add other categories, change their event visibility and add other cities.
We are also currently offering a limited beta to some of our customers to a new category – academic events. At this stage the beta only includes US tertiary education dates. Academic events have huge impact on companies with stores near university and college campuses where the difference between study weeks and holidays can remove thousands of customers.
All of the features mentioned above requires huge quantities of verified and ranked event data. Sourcing enough data may seem manageable for teams at first — before they try to use the data in their models, and realize that aggregation is only the first step towards the demand intelligence they need.
PredictHQ aggregates and standardizes hundreds of event sources into a single API. All the events supplied by our providers are processed through our Event Pipeline. We detect and monitor a variety of data issues throughout the process (such as but not limited to; duplicates, geocoding, spam) to ensure data quality.
We work closely with teams set up their access to our demand intelligence and learn to use it as effectively as possible.