Event impact insights for local and global businesses

Free Trial - No Credit Card Needed

Free

Explore future event impact on your staffing, inventory and pricing plans

$0

USD

/month

* Up to 2 locations, 2 mile radius

  • Web Application
  • APIs: Limited
  • Future Visibility: 3 months
  • Historic Visibility: None
  • Location Type: Radius only
  • Event notifications

This plan is ideal for:
Anyone wanting to try and explore our data.

Starter

Leverage customizable and scalable event impact data to drive growth

Starts from

$60

USD

/month

billed at $720 USD/year

  • Everything in Free, plus
  • APIs: All
  • Event categories: Add-on
  • Future Visibility: Unlimited
  • Historic Visibility: None
  • Location Insights: Unlimited
  • Location Type: Radius, entire cities
  • Radius: Maximum
  • Integrations: Snowflake, ADX
More pricing details

This plan is ideal for:
Revenue Management, Business Analysts, Product Managers, Operations, Developers

Premium

Unlock efficiency at scale with robust forecast modeling

custom

Contact us for pricing

  • Everything in Starter, plus
  • Event Categories: All
  • Future visibility: Maximum (years)
  • Historic visibility: Maximum (years)
  • Location type: Unlimited areas from cities, regions, countries
  • Integrations: All

This plan is ideal for:
Data Engineers, Data Scientists, Developers

Try us out

Event Impact Calculator

Choose any location globally to quickly calculate the spend generated by nearby events.

The Suggested Radius automatically returns the optimal radius based on your business type and the location that gives you just enough relevancy for your location, while excluding irrelevant events that likely wont have an impact.

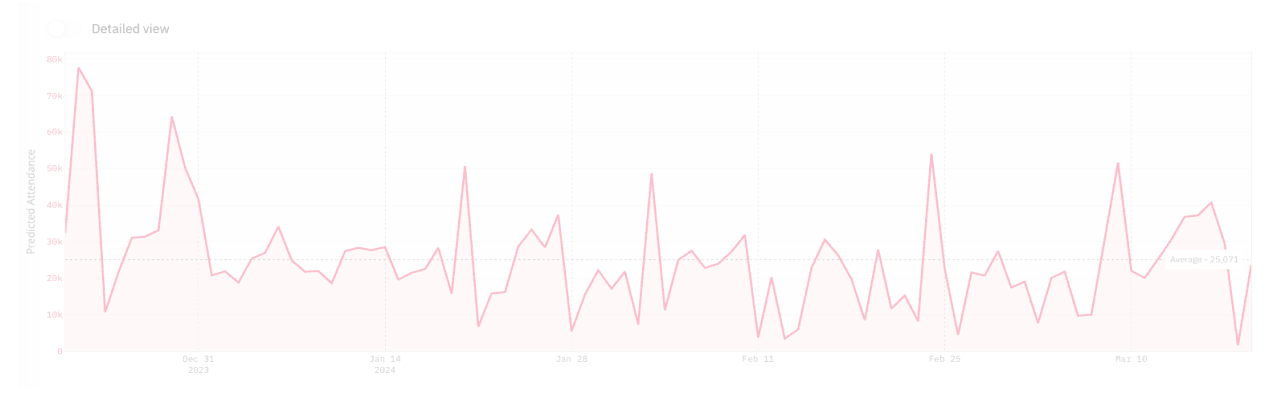
Event Impact over next 90 days

  • Predicted Attendance

    The predicted number of people attending events within a location

    -

  • Attended Events

    The sum total of Attended Events (e.g., sports, festivals, concerts, conferences, expos, and community)

    -

  • Suggested Radius

    Suggested Radius is the optimal radius based on your business type and the location that gives you just enough relevancy for your location, while excluding irrelevant events that likely wont have an impact.

    -

  • Predicted Event Spend (USD) - All Industries

    This figure is calculated from our core PredictHQ data, enriched by local economic indicators and partner data

    -

  • Accommodation

    -

  • Restaurants

    -

  • Transportation

    -

Event Trends Graph
14 day free trial

Maximize your free all access trial with no limits

Test our Web Application and APIs for free. After 14 days, your trial
expires and you will be automatically switched to the Free Plan.
  • Unlimited Location Insights
    Unlimited Location Insights
    Location Insights allows you to add and track your locations of interest to identify future event impact most relevant to your business. The trial lets you add an unlimited number of Location Insights.
  • Event Notifications
    Event Notifications
    Make smart decisions faster with relevant real-time alerts about events. Setup notifications for different locations when you are on the trial. You can use demand surge notifications and event change notifications on the trial.
  • Snowflake Integration
    Snowflake Integration
    Use Snowflake Secure Data Share to access Events data via Snowflake. Contact us to set up your access.
  • All Location Types
    All Location Types
    Use our street address and radius locations or set up locations for entire cities, states or countries.
  • Demand Surge Impact
    Demand Surge Impact
    Demand surges are where multiple events occur at the same time around a location. Find demand surges to make sure you are prepared for them using notifications and the daily event impact functionality.
  • ADX Integration
    ADX Integration
    Use AWS Data Exchange to access Events data. Integrating with ADX is a quick and easy way to get access to events data in your environment reducing the effort needed from your technical teams to ingest the data. Contact us to set up your access.
  • Unlimited Max Radius
    Unlimited Max Radius
    For Location Insights you can find all events around your location. For street address locations you can set a radius. For the trial we allow you to set a radius of up to 37 miles (60 kilometers), or to select an entire city, state or country.
  • Events API
    Events API
    Access your demand causal factors in a single API. Breakthrough insights for more accurate demand forecasting, operational platforms, event calendars, and much more. You can access our API while on the trial.
  • Tableau Integrations
    Tableau Integrations
    Easily explore large volumes of demand intelligence and make strategic decisions faster with our Tableau Data Connector - no code required.
  • Central Dashboard
    Central Dashboard
    Control Center is a central hub where you’ll be able to explore, search, manage and use PredictHQ’s demand intelligence data in one place. Our dashboard is your entry point to all of our Control Center features like event search, daily event impact, notifications, API explorer, and more. It also shows you your top locations with the highest predicted attendance for upcoming events.
  • Features API
    Features API
    With the Features API, no need to build complex data handling systems or build features on your own. The API aggregates and makes available core statistics from our underlying event datasets, enabling you to use the features directly in your models, without having to do preparatory work to integrate with us.
  • Ranks
    Ranks
    We have built a series of models to predict attendance and rank events by impact so you can quantify expected impact for each event. Our event ranking systems predict the impact of every event and assign each with a number on a 0 to 100 logarithmic scale. Focus on the events that matter with PHQ Rank™, Local Rank™, and Aviation Rank™.
  • Event Search
    Event Search
    It’s effortless to find relevant events for your business with our easy-to-use search tool. Identify which of the millions of events worldwide will drive incremental or decremental demand so you can prepare.
  • Live TV Events API
    Live TV Events API
    Our Live TV Events API accurately predicts the viewership for major televised sports games across the USA, using more than 20 distinct features including viewership trends and the uncertainty of the matchup. This can help you forecast how these games will drive purchases such as food, beverage, delivered food, and retail decisions.
  • Plus more

Interested and not sure which subscription you need?

See how your event data compares for free

Tracking events is complex, it's why we exist. Our core business is to collect, verify and enrich data and we don't expect our customers to have it all figured out.

We know that many customers have their own internal event database or collect data from a variety of sources. Send us your current event data set and we'll tell you what what you may be missing across different event categories, number of events and quality of data.

Simple. Accurate. Free.

Compare Data