Decompose your data in seconds with our Demand Analysis Tool


What is demand decomposition?
Demand decomposition is the process of breaking down a time series of demand data into its underlying components. Plotting your demand data on a time series and isolating the factors that cause it to fluctuate is often the first step on the journey to better understanding what drives demand to your business.
Beam is our analysis and correlation engine which allows you to get forecast-grade, time series-ready data for free, and at scale. Let’s take a look at how Beam decomposes data, and how to get your decomposed data via our web application or via API.
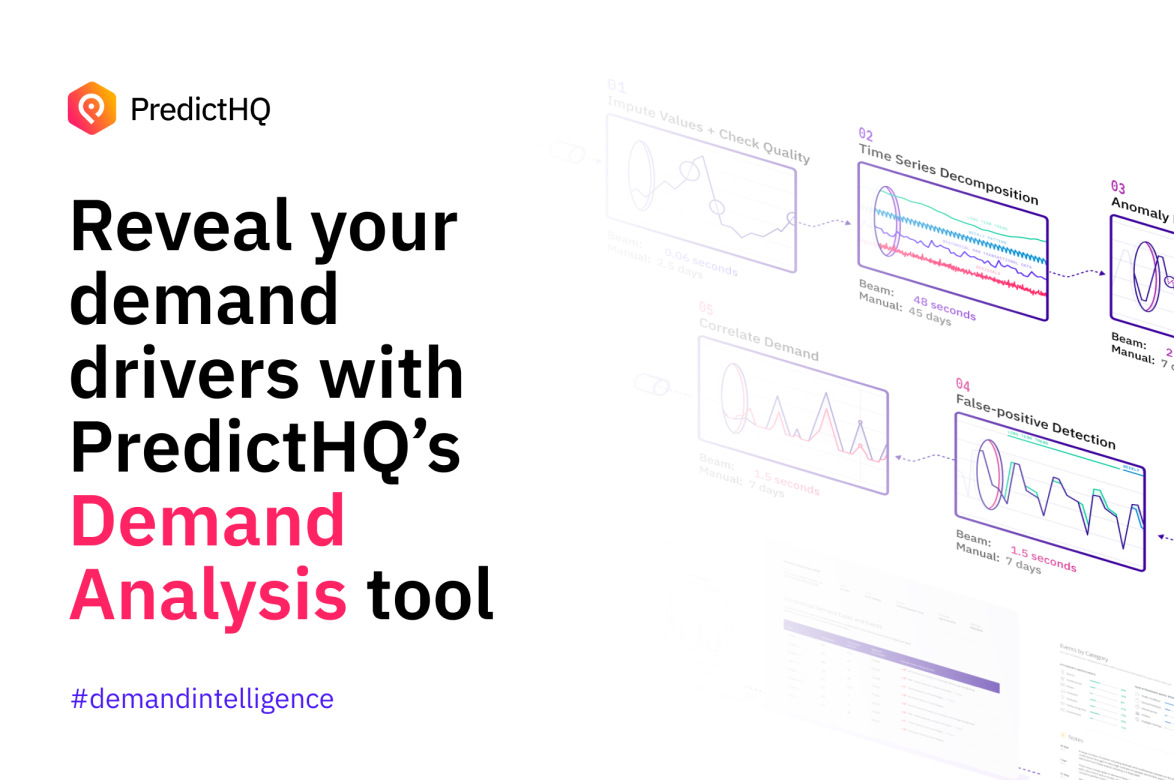
How the Demand Analysis Tool decomposes your demand data
Businesses and their demand are affected by many factors. Certain factors, like seasonality, can be easily accounted for by forecasters and analysts.
For many businesses, the magic lies in trying to understand and account for the more unpredictable factors – called residuals in a classic time series analysis. This represents a noticeable, but difficult-to-understand impact on your demand – which is typically attributed to events.
Whether you’re looking to plug your data into a forecasting model, or simply to gain a better understanding of it, Beam can help you break down the crucial data that keeps your business running. Via our newly released APIs, the tool lets you view your data as a decomposed time series consisting of the following:
Date: The time range during which demand was higher or lower than expected
Actual demand: The observed demand during a given time range
Baseline demand: The expected demand with seasonal and overall trends factored in
Residuals/Remainers: Deviations from the expected baseline demand that could be attributed to event impact
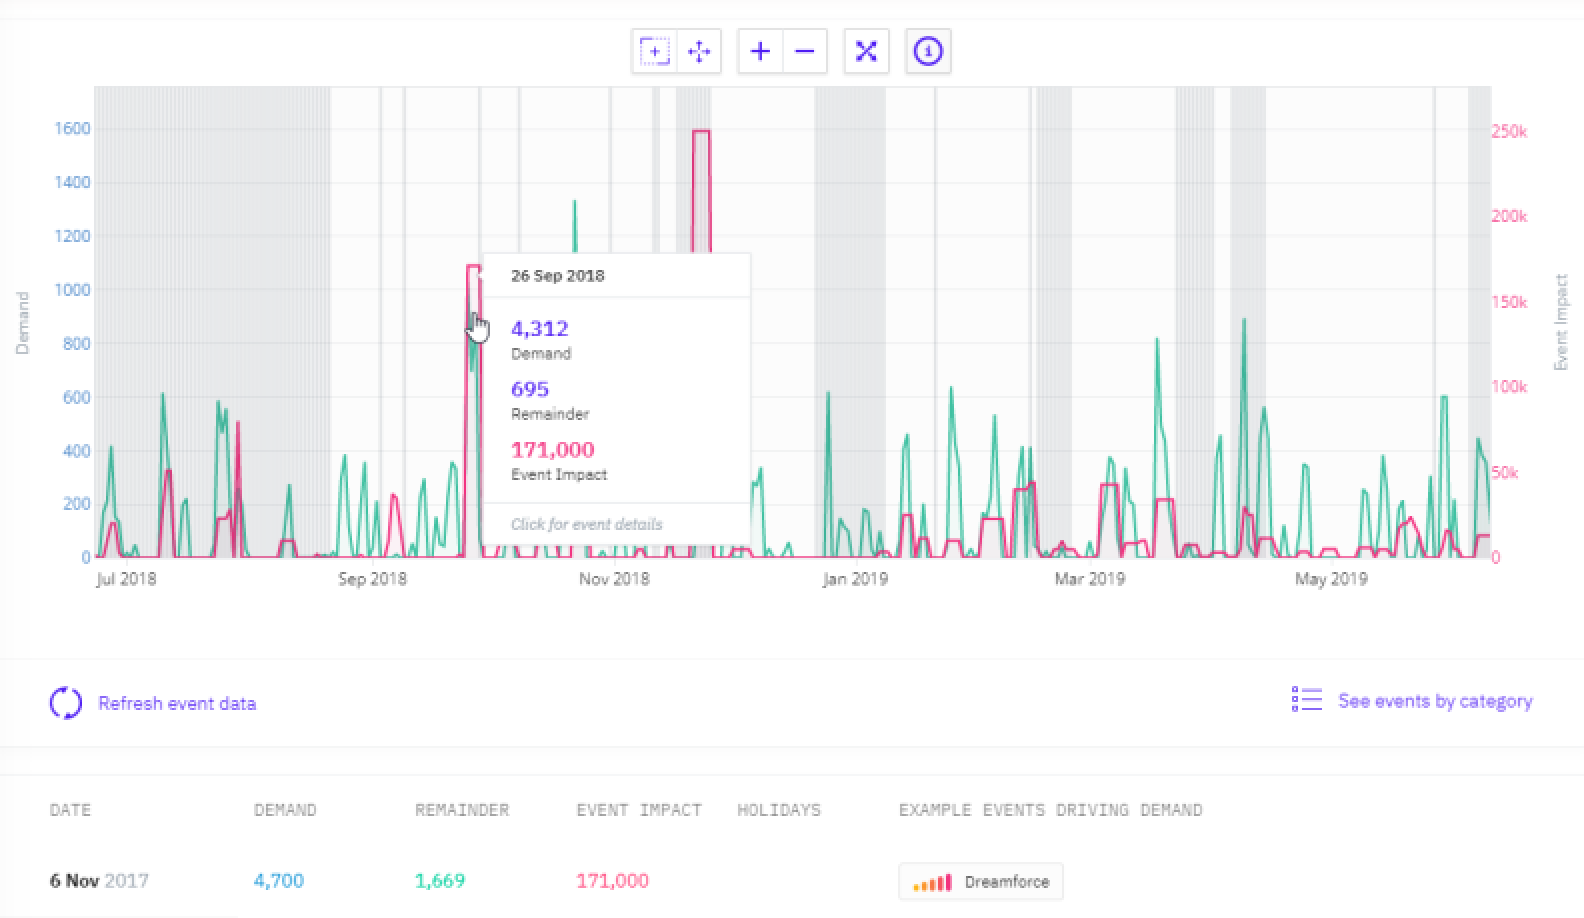
By understanding the residuals and potentially how much impact can be attributed to events, you will be better poised to anticipate and respond to similar events in future.
How to decompose your data in our web application
Use Beam to quickly decompose demand for one location (or many) in two easy steps:
Log in to our web application—Control Center—and upload your demand data for each location
Then, simply export the data to get your decomposed data
Find out more about how to use Beam in Control Center in our support documentation. If you’d like to decompose demand data for a large number of locations, you can use our Beam API.
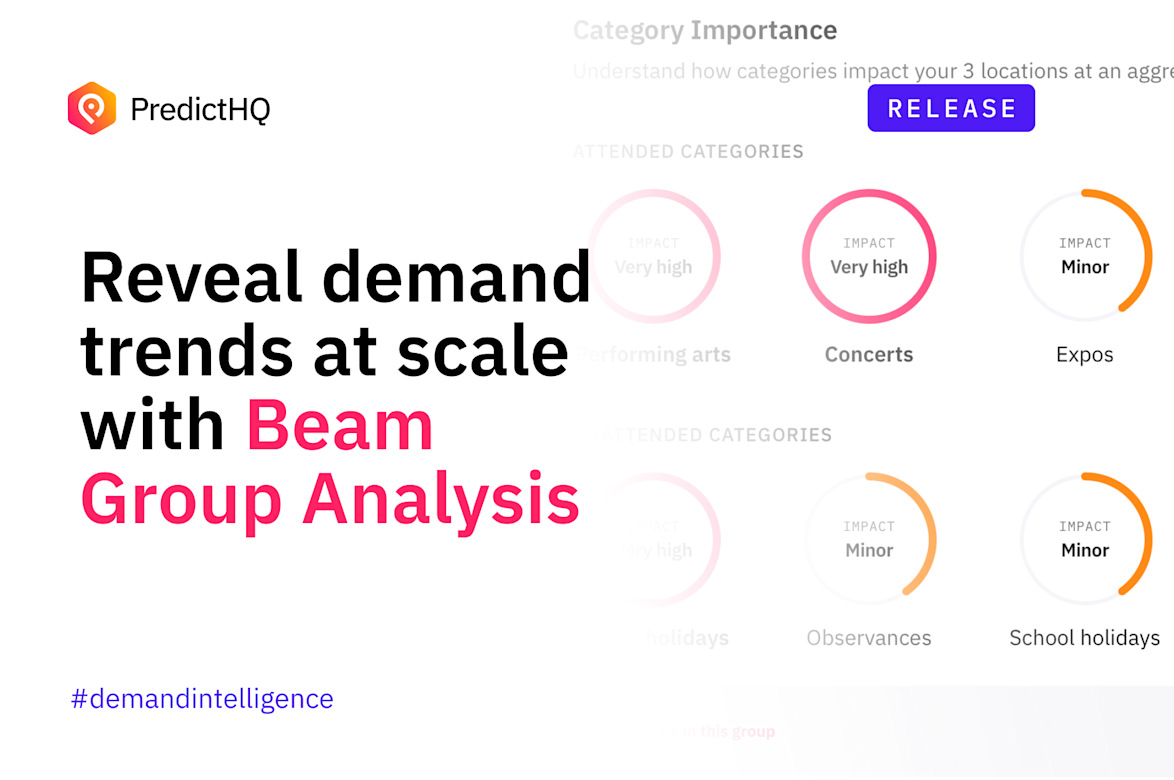
Decompose data at scale: Introducing the Demand Analysis API
We have just released a new API that allows you to decompose a large amount of data at scale. With the API, you can create code to process your input data (for example, to load data from a database or an input file), to create analyses, and to extract the decomposed data.
You could write a script to process data for hundreds, or even thousands of locations, and extract the decomposed data for use in your models. This also allows you to use the data decomposed by Beam in your own models and analyses. Automate the process of decomposing the data, and pass the decomposed data into your models, feature importance testing, or simply to gain a better understanding of the levers that might affect your demand.
Not only can you use the Demand Analysis API for bulk decomposition, you can also use the API to view the correlation between your demand and the event impact data. Or – you can view the results for the analyses you upload in Beam. Use the API to bulk upload the data, and then download the correlation results with the API, or view within Control Center. See our Demand Analysis API documentation here for details.

Decompose your demand data for free today
Join the ranks of industry leaders using Beam to save time decomposing demand data. Start using Beam today to decompose your transactional data and better understand your demand data. Upload a sample dataset to immediately reveal how events drive demand.