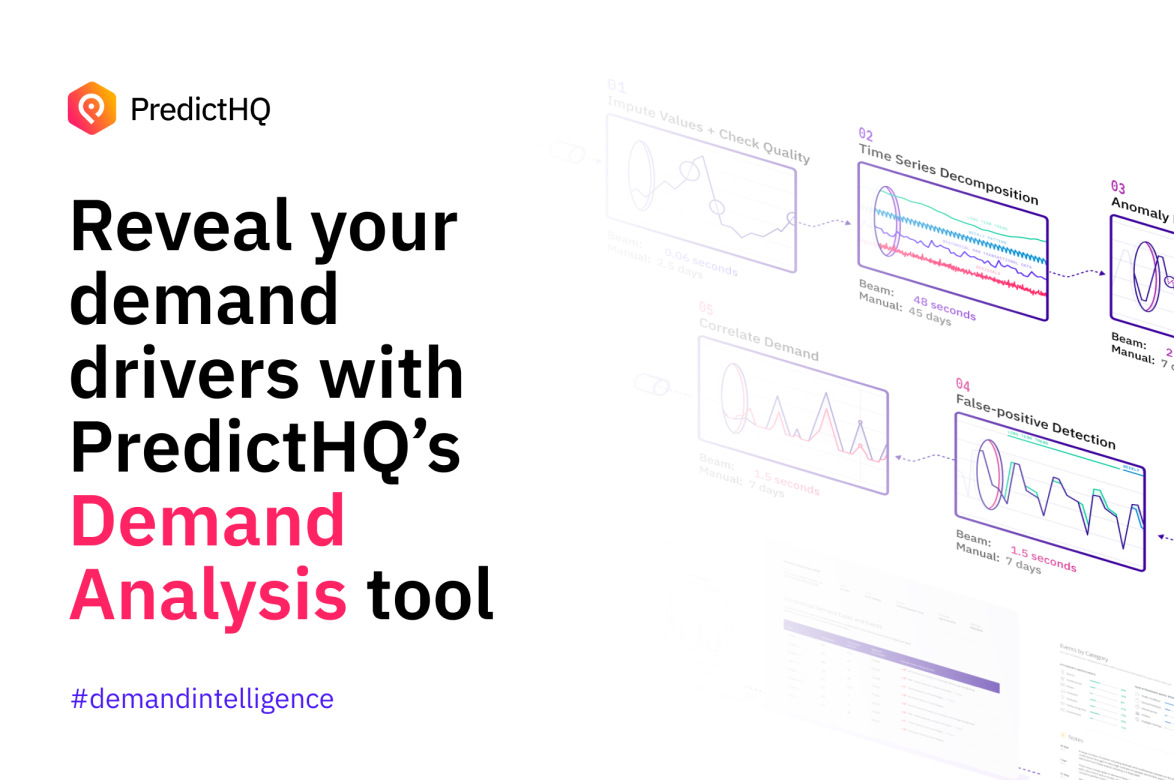
How to filter noise, not demand


I’m surrounded by events, now what?
By now you have likely used Location Insights to get a quick 90-day aggregate of all events around your chosen locations, so you can tell if they are busier than usual. All PredictHQ accounts allow you to track three of your locations of interest for free. As you begin to look into the specific details surrounding these locations, a natural reaction is to try to filter out some of the noise of seemingly irrelevant events from the thousands to millions of records you see. Let’s review three important signals to help you filter out the noise.
1. PredictHQ Attendance
With a value like PHQ Attendance, a numeric value on a logarithmic scale, it’s easy to do this by setting a filter to exclude events below a specified ranking band or predicted attendance number. The Rank filter can be applied in various areas of our web application and via our Events API using the rank_level or rank.* parameters.
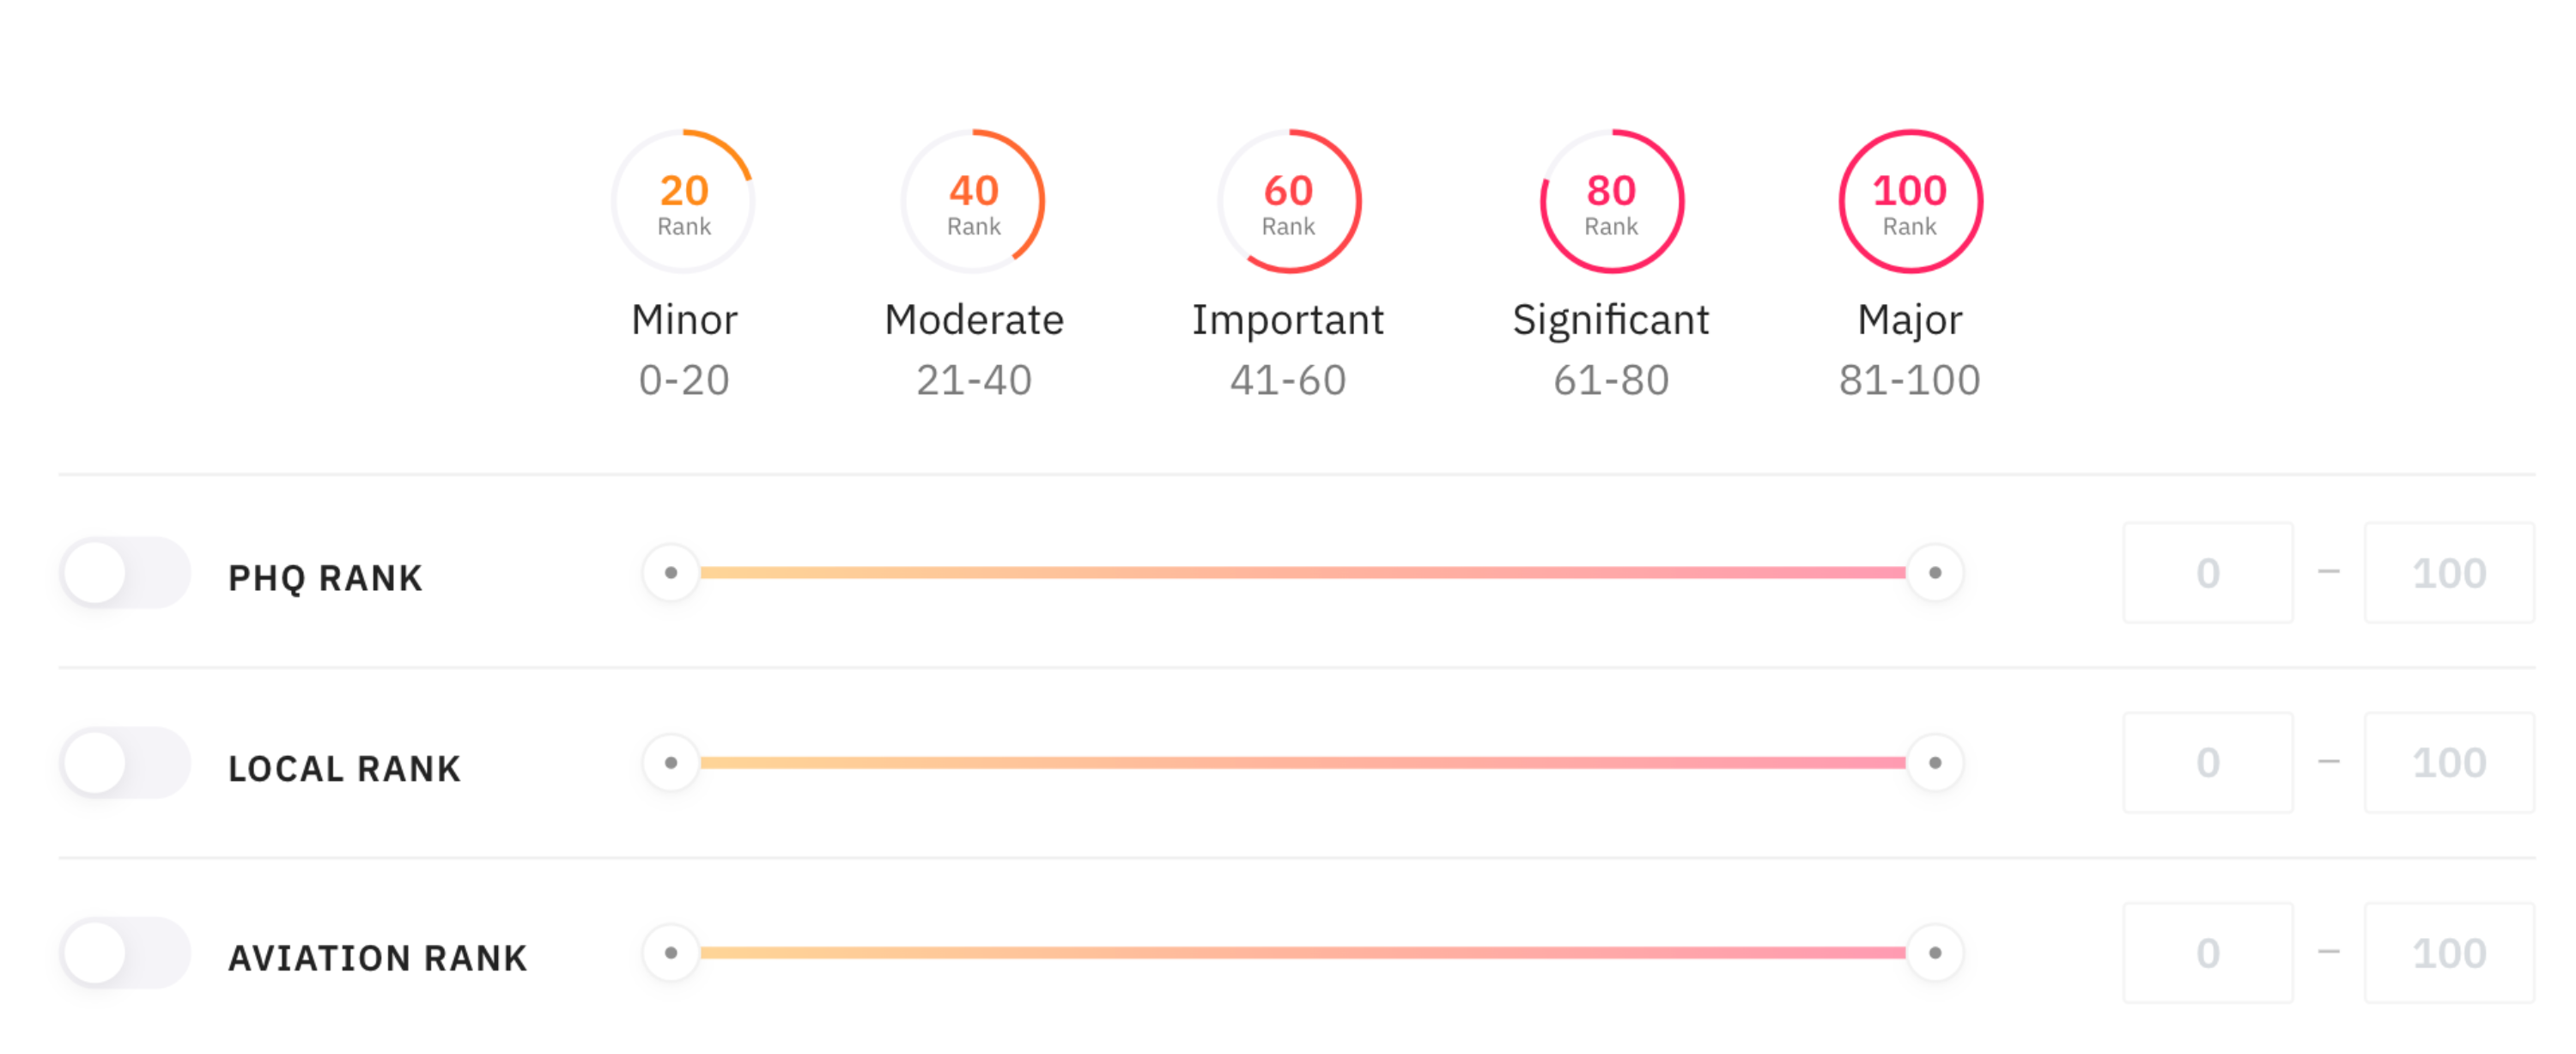
To consider and decide if you would like to use PHQ Rank exclusively requires a deeper look at the locations that are important to you, and the demand signals you might see within the data. You can also learn more about our various ranks to see what makes sense for you to use. Let’s dive into two more ways to analyze events to spot potentially overlooked demand signals and to make sure you’re focusing on the right events for your business.
2. Location makes a difference
Local Rank is a value often overlooked in the initial stages of working with the data but is a critical component to make use of when your locations fall outside of busy metropolitan areas. While PHQ Rank provides a way to quantitatively compare events based on their estimated impact independent of their location, Local Rank considers population density as an added element to the attendance number. This provides a simple way to compare events based on the impact they are estimated to have in their local area.
For example, for the 2023 Chinese New Year Parade taking place in San Francisco, the PHQ Rank is 100, as is the Local Rank. These impact scores are logical, as a million people expected in any location would have a huge impact on the surrounding area.
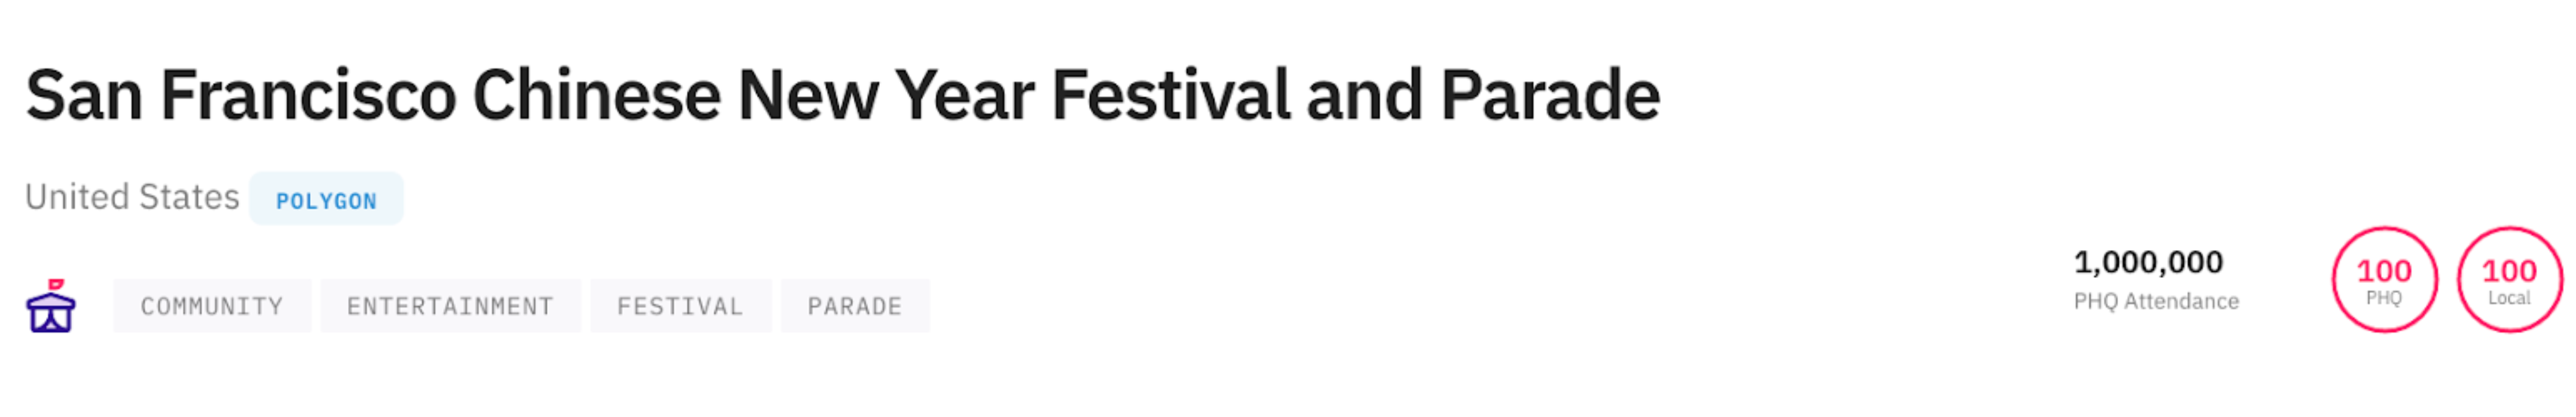
Comparatively, if 5,000 people attended a festival in San Francisco, there might be a small impact on the surrounding retailers, but nothing significant given the amount of regular foot traffic in the city of San Francisco.
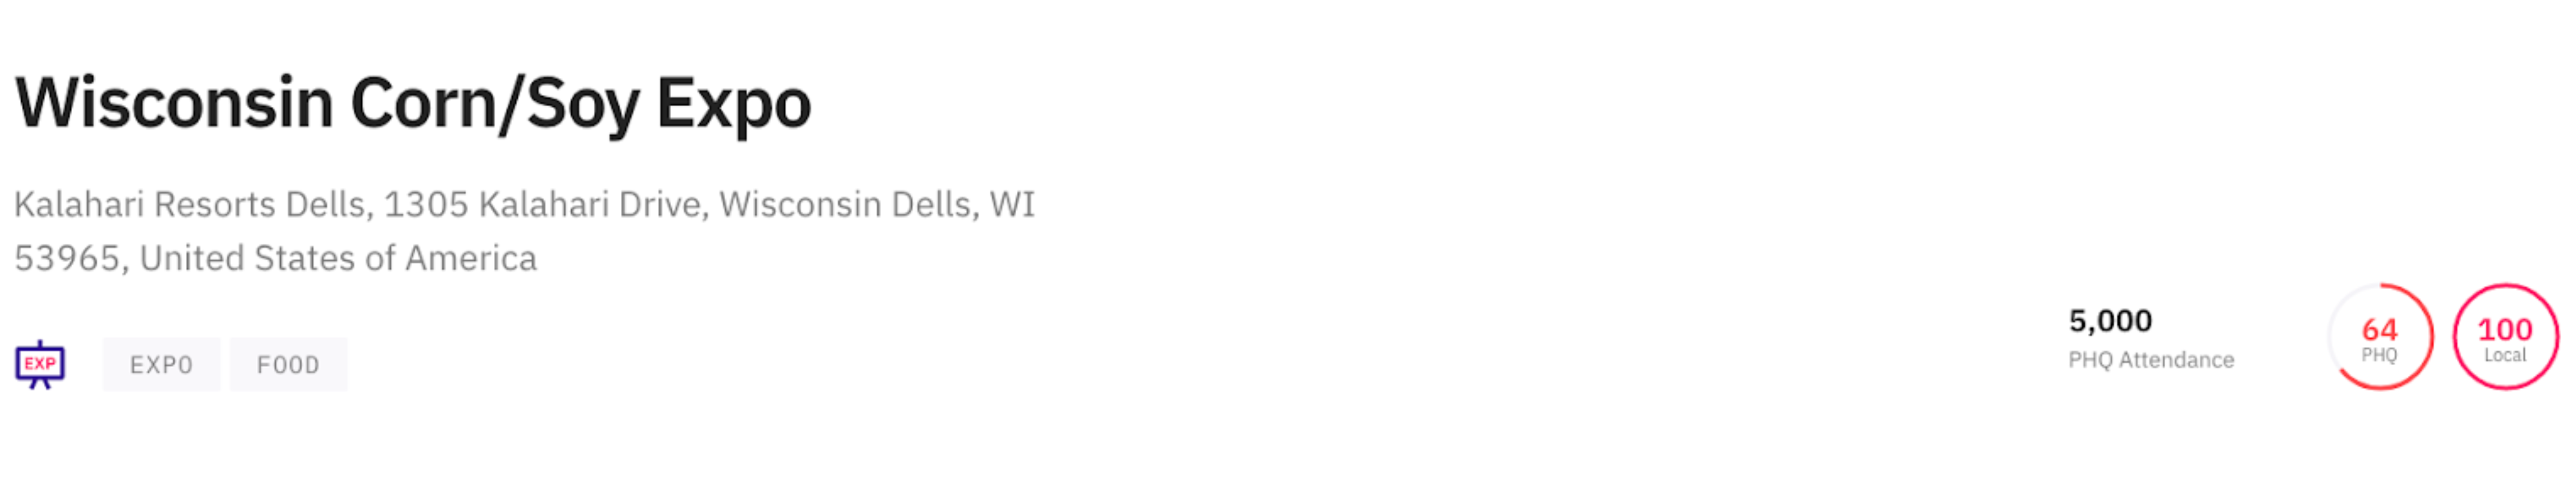
Alternatively, if a similar sized event happened in a small town or city, the impact would be much greater. For example, what if 5,000 people attended an expo in Wisconsin Dells? In 2021, Wisconsin Dells had a reported population of under 4,000, so an expo with 5,000 attendees would have a major impact on the community around it. We can see the value of Local Rank maxing out at 100 for this event, whereas if Local Rank had not been considered, the event might have been filtered out as unimportant.
3. Event aggregation without the manual effort
There is one more scenario where events might be incorrectly viewed as unimportant: when events below a certain rank threshold continue to be filtered out, even though both PHQ Rank and Local Rank are being considered. The reason for this is that six small events with 5,000 attendees, for example, could drive the same demand as one event with 30,000 attendees – if the small events occur in the same time period. The easiest way to spot this perfect storm of demand is by looking at the data in an aggregated manner.
In the PredictHQ web application, Daily Event Impact provides a visual representation of peaks in demand to more easily prove correlations between events and demand for your business.
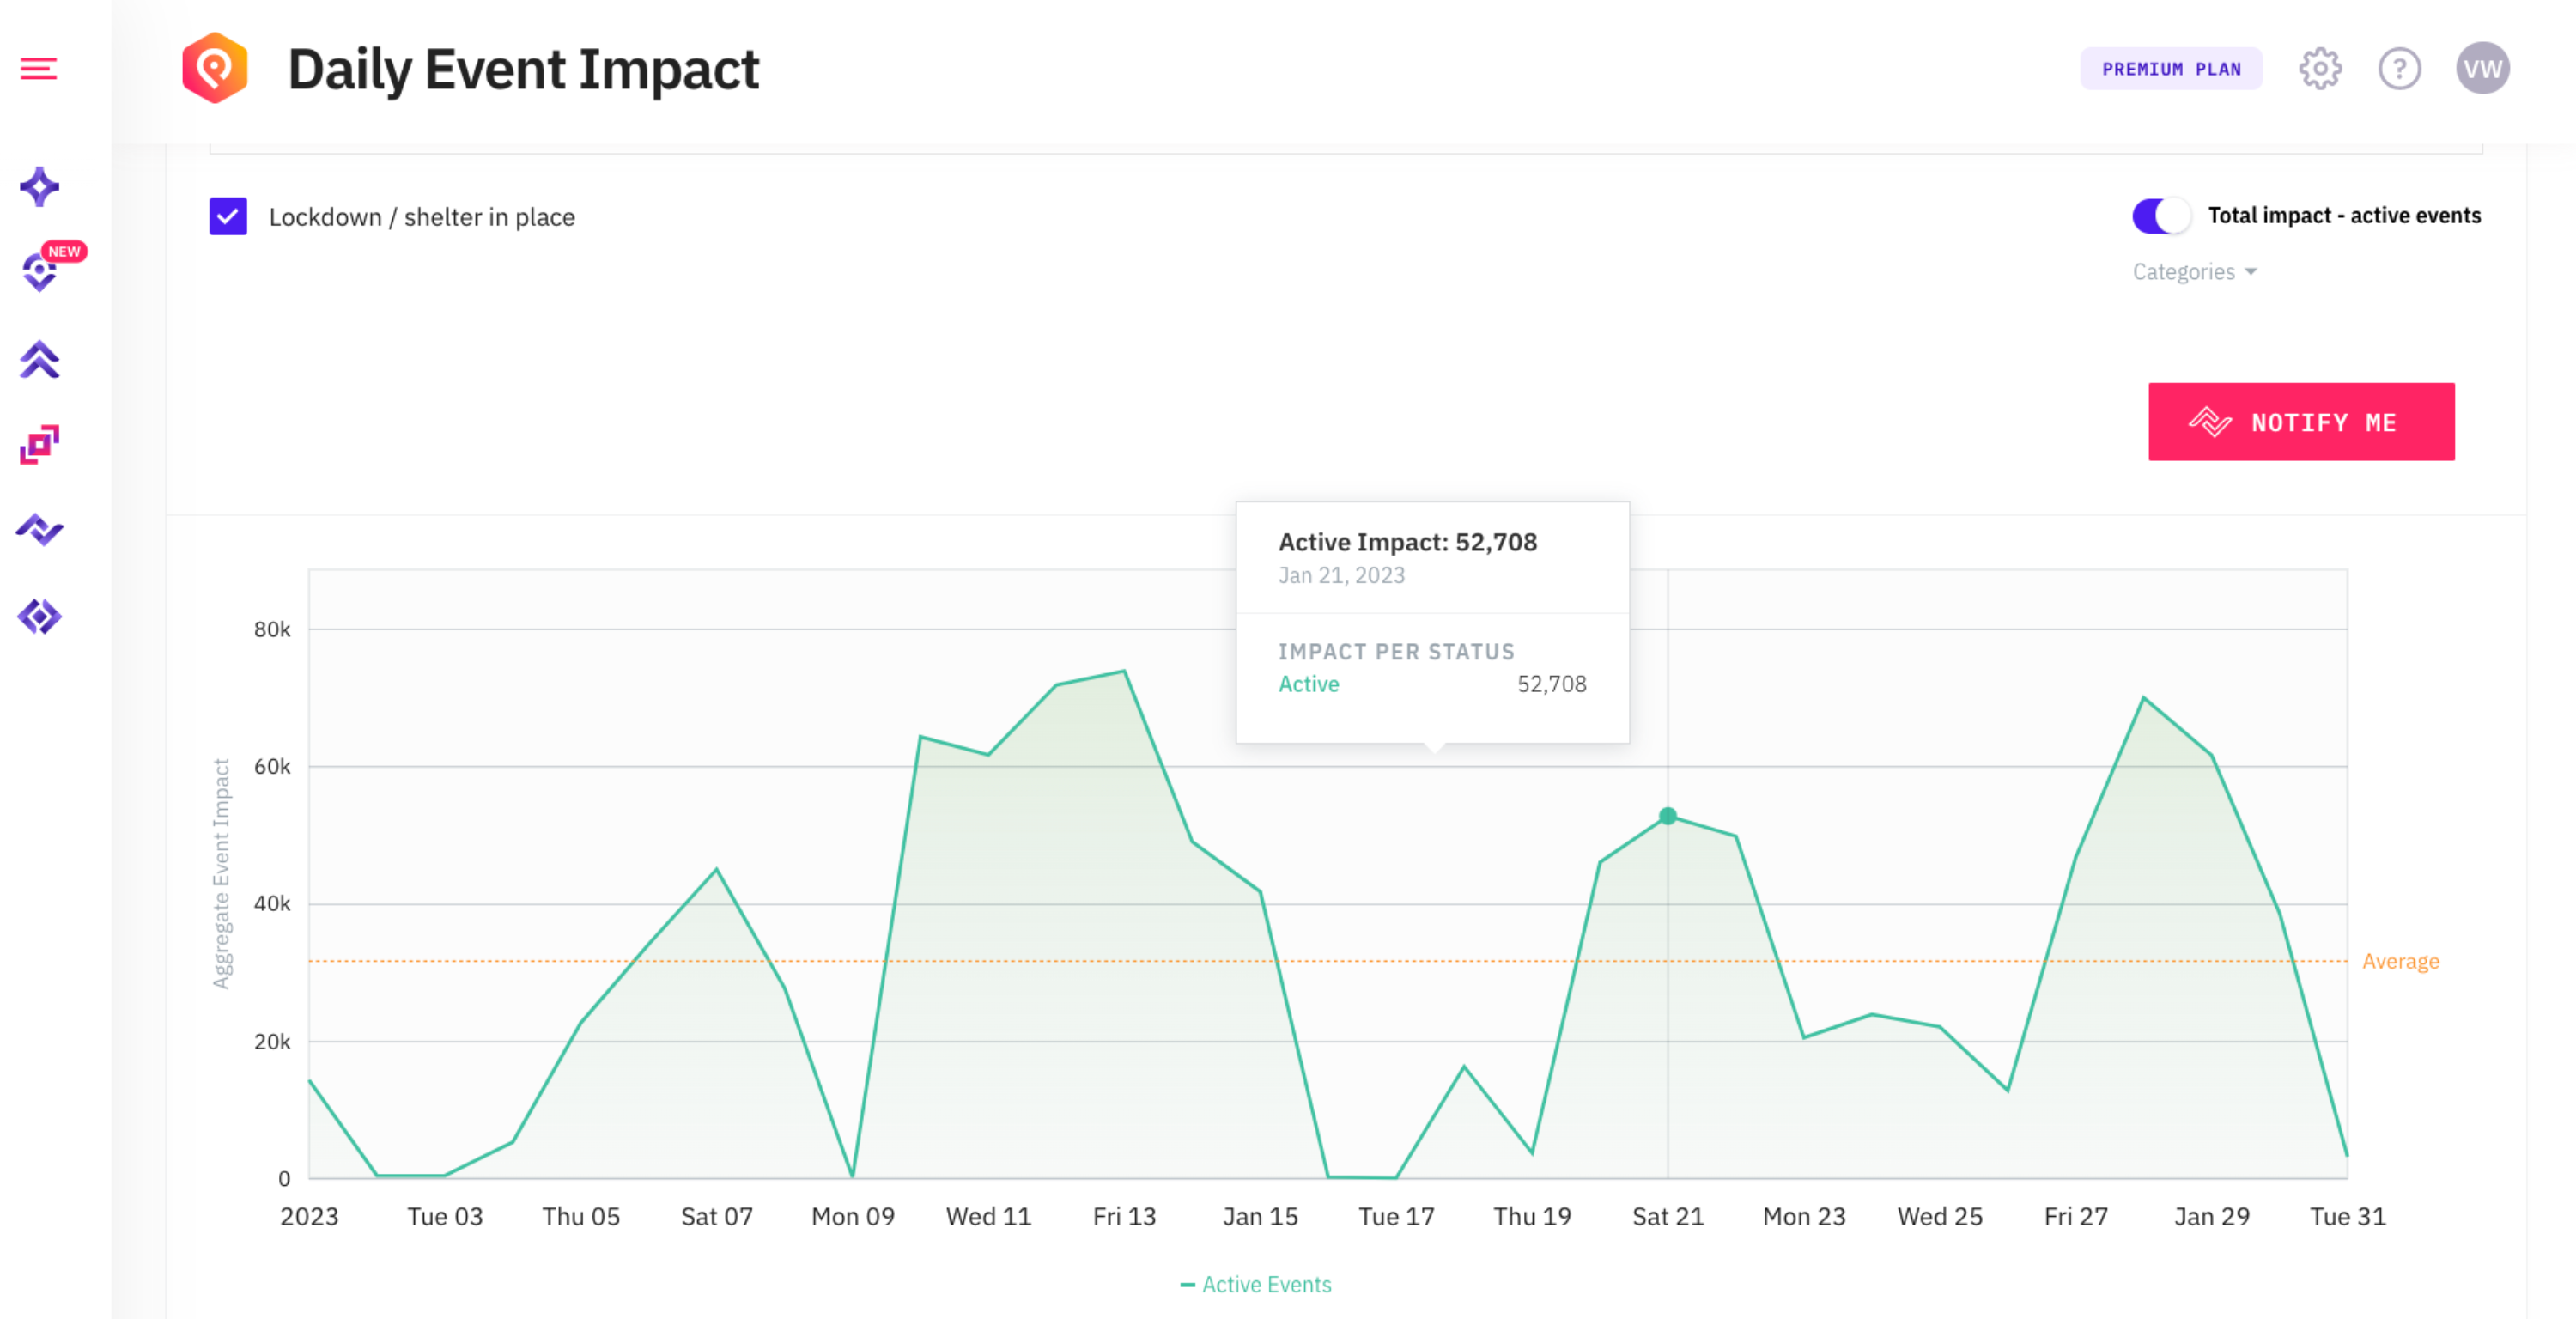
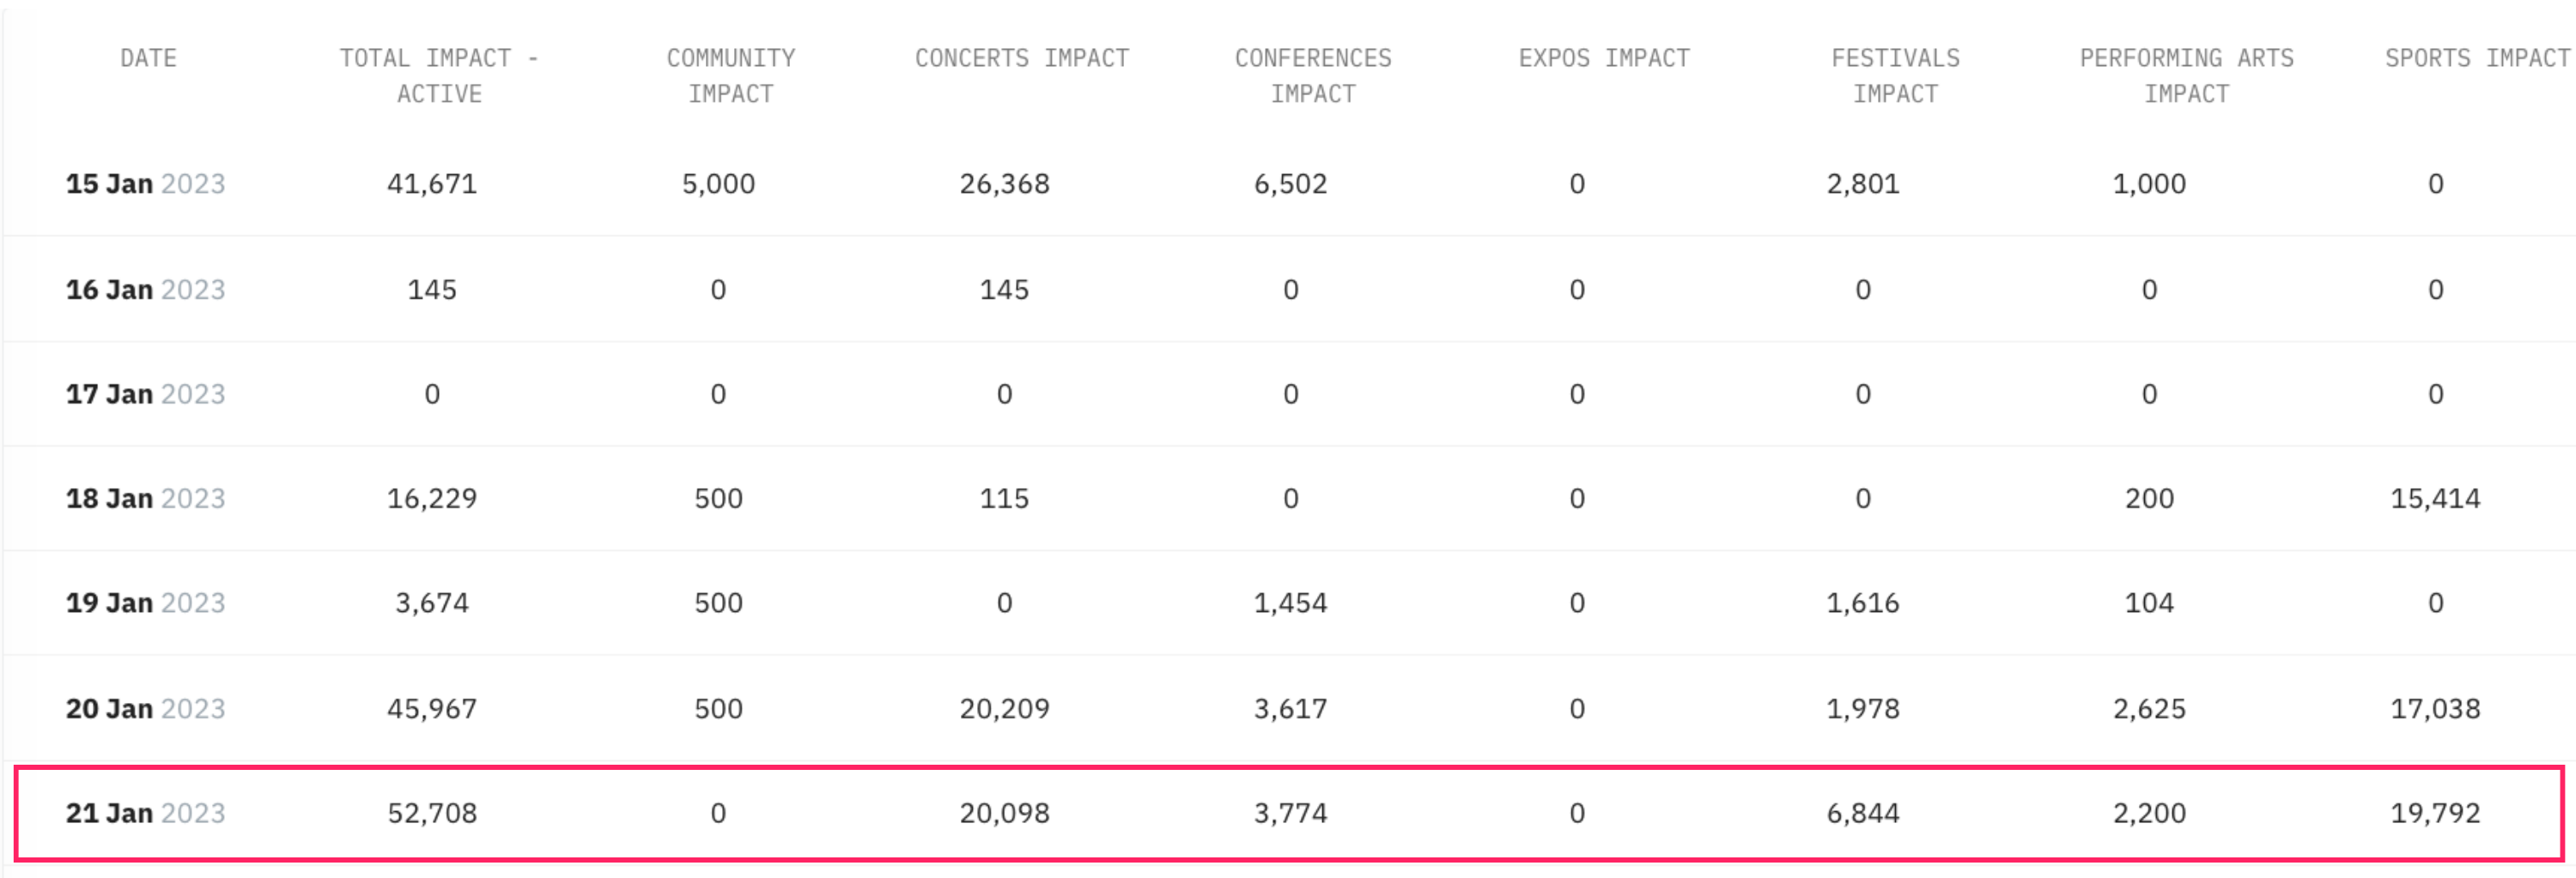
In the visual above, you’ll see that the peak on January 21 in Dallas shows that the estimated total impact of 52,000 attendees is made up of events in 5 different event categories. In our web application you can take a closer look at the details of specific events contributing to this peak by clicking on the date within the chart. You can also scroll down on this page to see a full breakdown of the demand peak, including event categories:
With aggregated views of the data, you are better equipped to filter out noise without foregoing critical demand signals. Log in to our web application to try the data for yourself, and better understand how event rankings work. You can also learn more about our ranks in our technical documentation.
Automate the signals you care about for your teams
Once you understand the importance of both ranks and aggregated event signals, Notifications makes it even easier to be aware of new events and surges in demand by allowing you to create an alert for your teams when predicted impact exceeds a threshold of your choosing or events change in your location of focus. Choose to receive a daily notification, or to receive notifications for new events within your selected criteria as soon as they become available in our platform.
Start identifying demand signals today
Once you are familiar with these initial ways to get the most out of your data, PredictHQ’s Customer Experience team can help you focus in on your locations in even more intelligent ways, such as understanding which event categories are most relevant to each location by correlating your historical demand data to events, as well as running an advanced suggested radius for your locations.