PredictHQ Quarterly Release – January 2023


Welcome to our January 2023 Quarterly Product Release! Each quarter, PredictHQ curates the latest product and feature updates to ensure you’re getting the most out of our platform. Let’s dive into the release to review what's new in our platform, and how to use these updates to get more value out of PredictHQ event data.
Level up your demand intelligence with five new updates that include:
100,000 Predicted Events added to the platform
Use Placekey to join datasets and unlock granular location-based insights
The latest updates to Location Insights
Academic events added to our feature engineering guide
Reveal your demand drivers with Beam, PredictHQ’s automated correlation engine
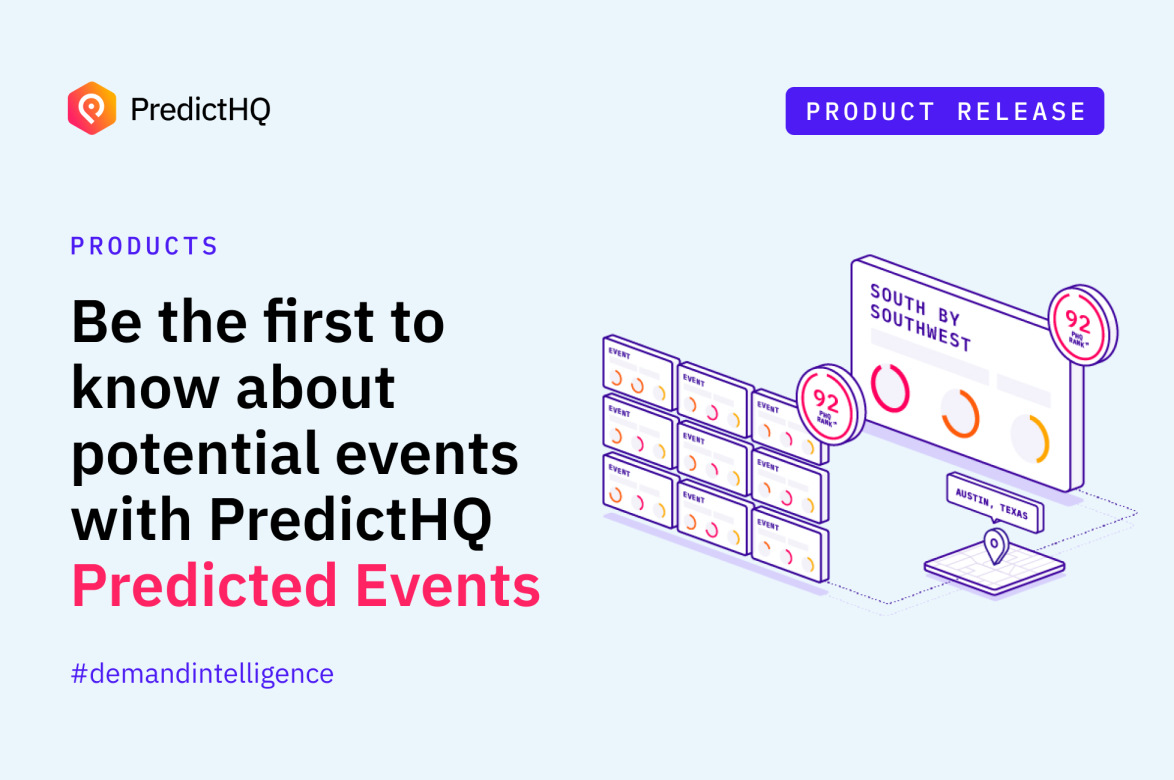
Introducing Predicted Events
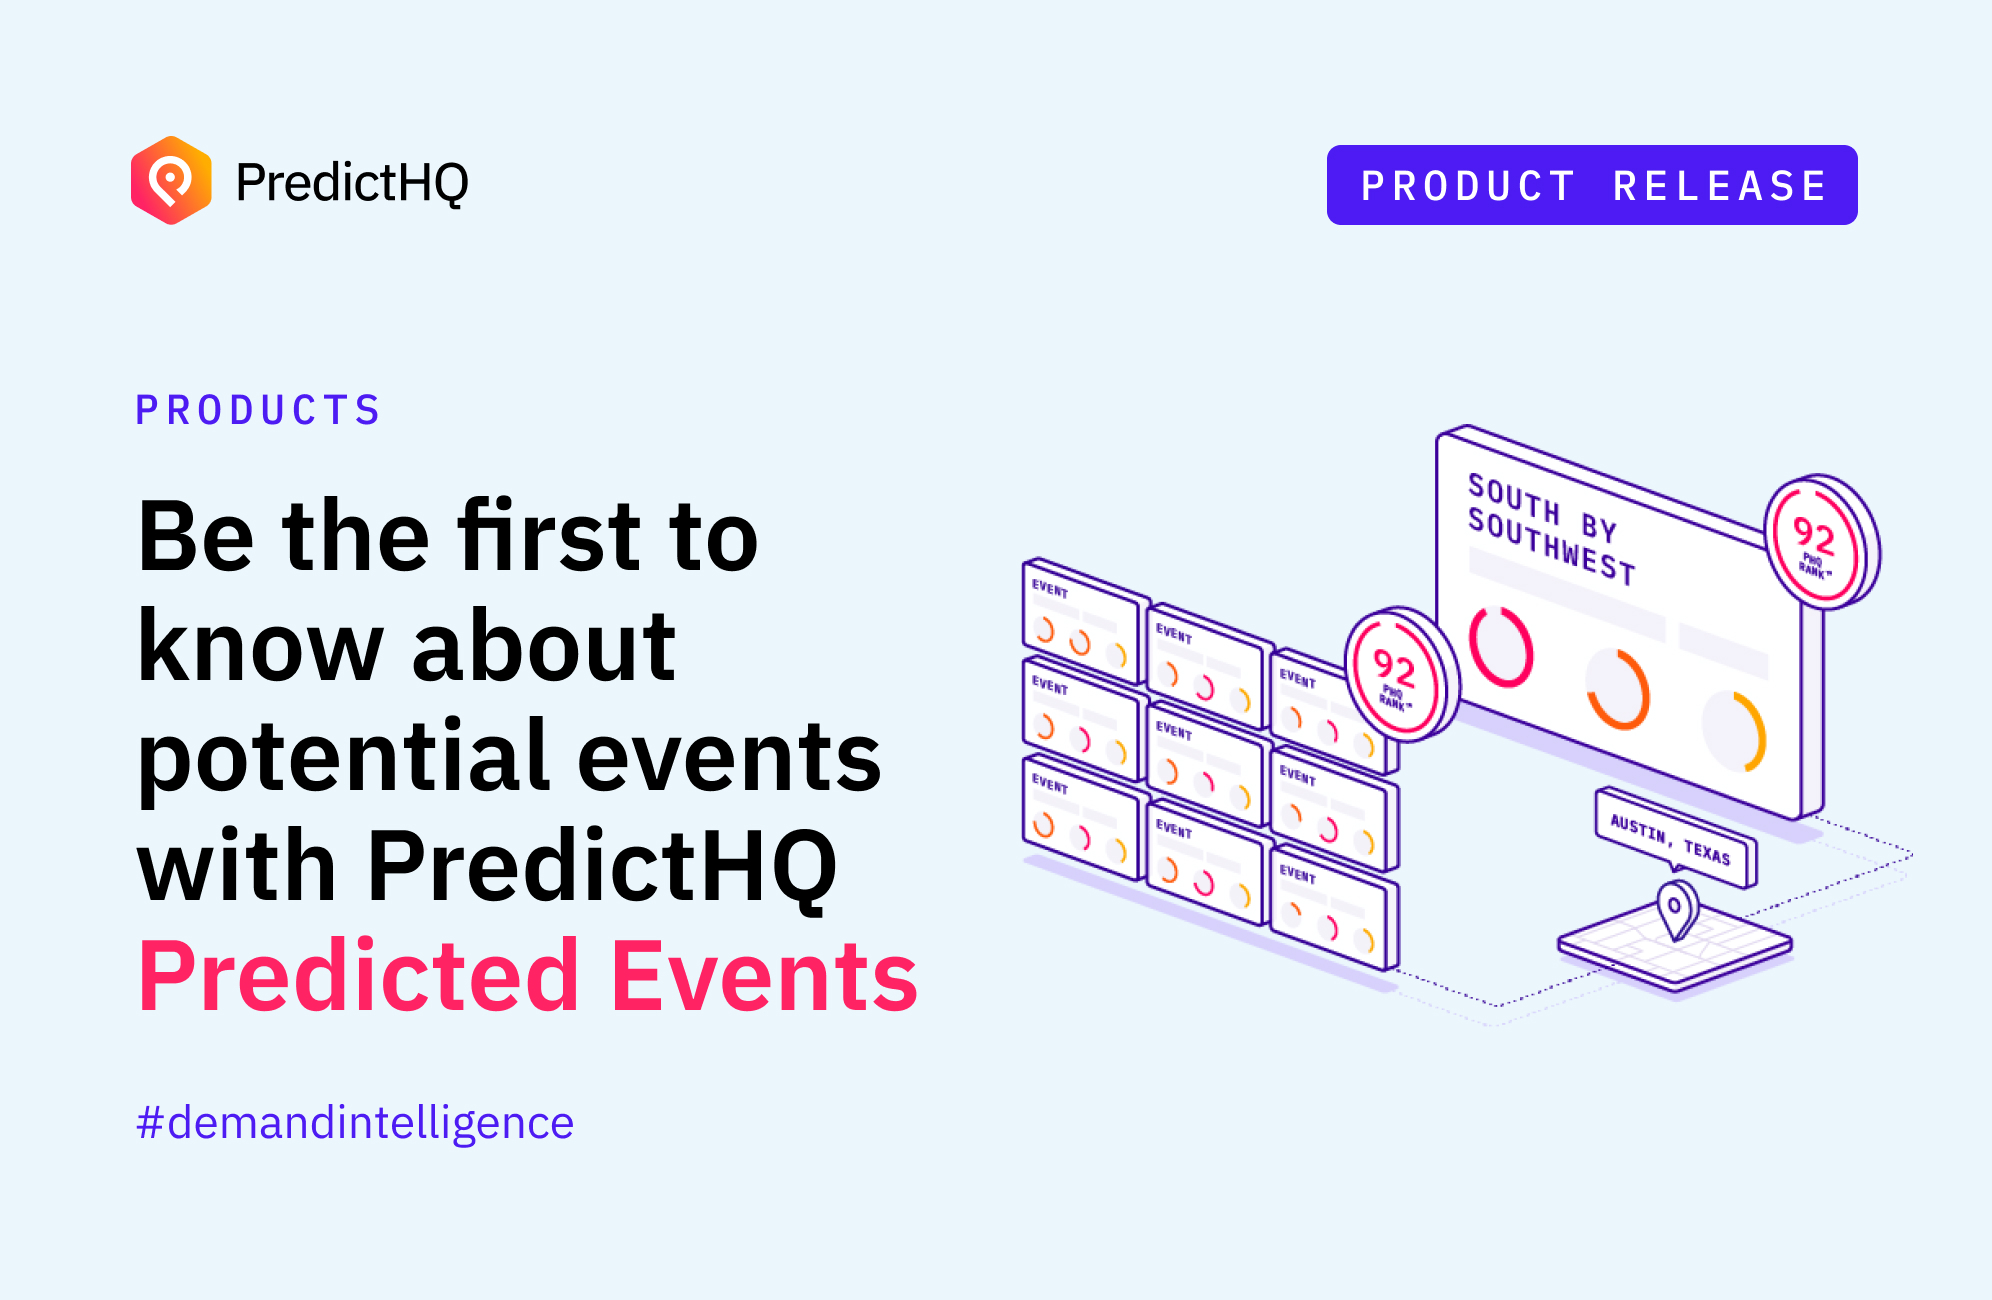
Typically, people tend to know when certain impactful events are going to occur, but the date, time, and location are not officially announced until a few months before they are live. Anticipate when and where these events will happen sooner with Predicted Events – events that haven’t been scheduled or even announced yet, but are predicted to occur based on years of historical event, entity, demand and venue data.
Learn more about using Predicted Events to see unconfirmed events and their approximate geographic area as early as possible so you can:
Easily assess whether these events would have an impact on your locations
Plan accordingly by adjusting your operations in advance
Factor future events into your planning before your competitors

Placekey is now available in PredictHQ products and tools
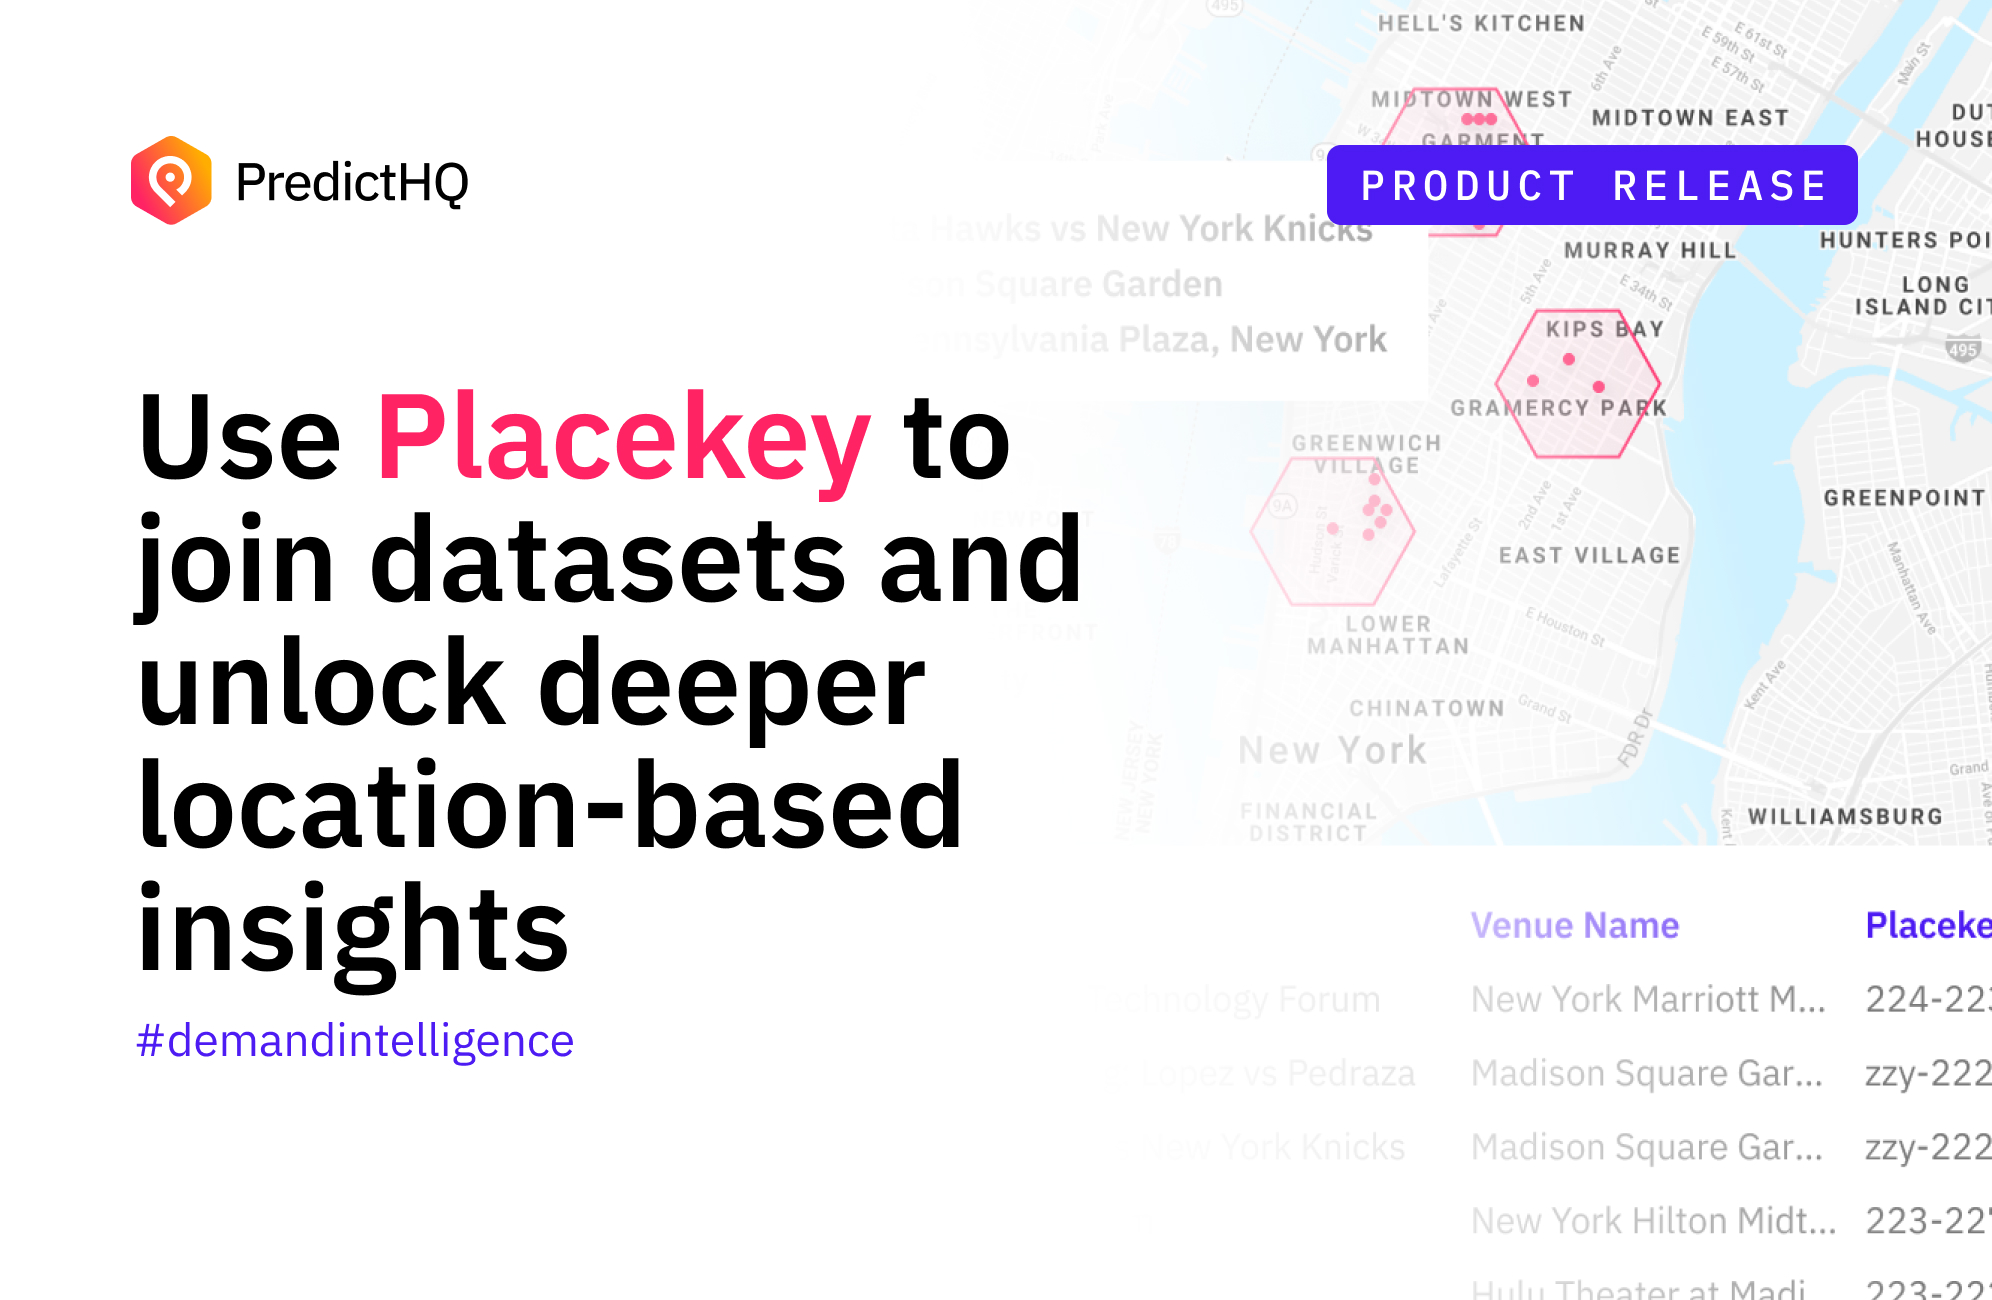
Placekey is a free, universal standard identifier for any physical place, which enables the data pertaining to those places to be easily shared across organizations. PredictHQ now provides Placekeys for events data to allow organizations to join our events data to other datasets that use Placekey. We’ve implemented Placekey for 7 attended event categories:
Joining, linking, and graphing datasets together allows businesses to ask more and different kinds of questions – opening up new use cases and making data infinitely more valuable.
One of the common joint data sets leveraging Placekey is events data and Point of Interest (POI) data. The event datah provides information about an event such as location and type of event and thePOI data provides additional information about where the event is taking place. One of the the POI provides PredictHQ has partnered closely with is SafeGraph – a data company that specializes in providing granular location data and insights including foot traffic data, visit duration data, and spend data, which businesses use to better understand consumer behavior and preferences.
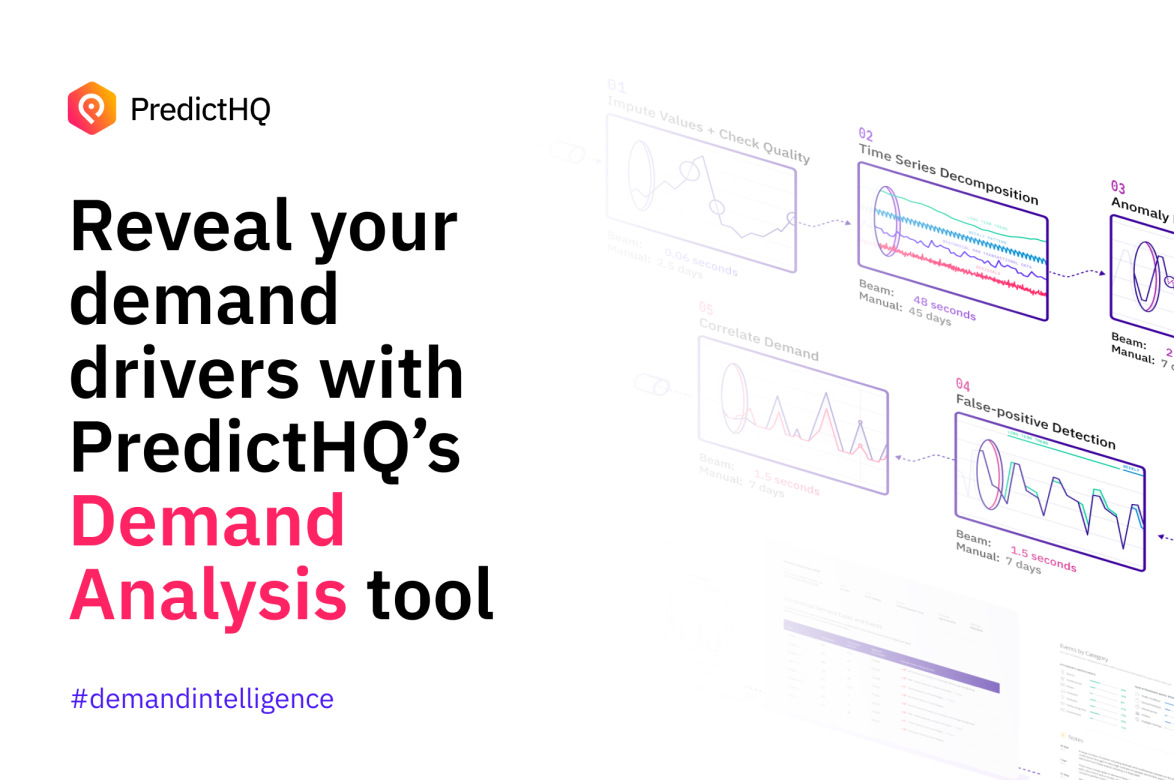
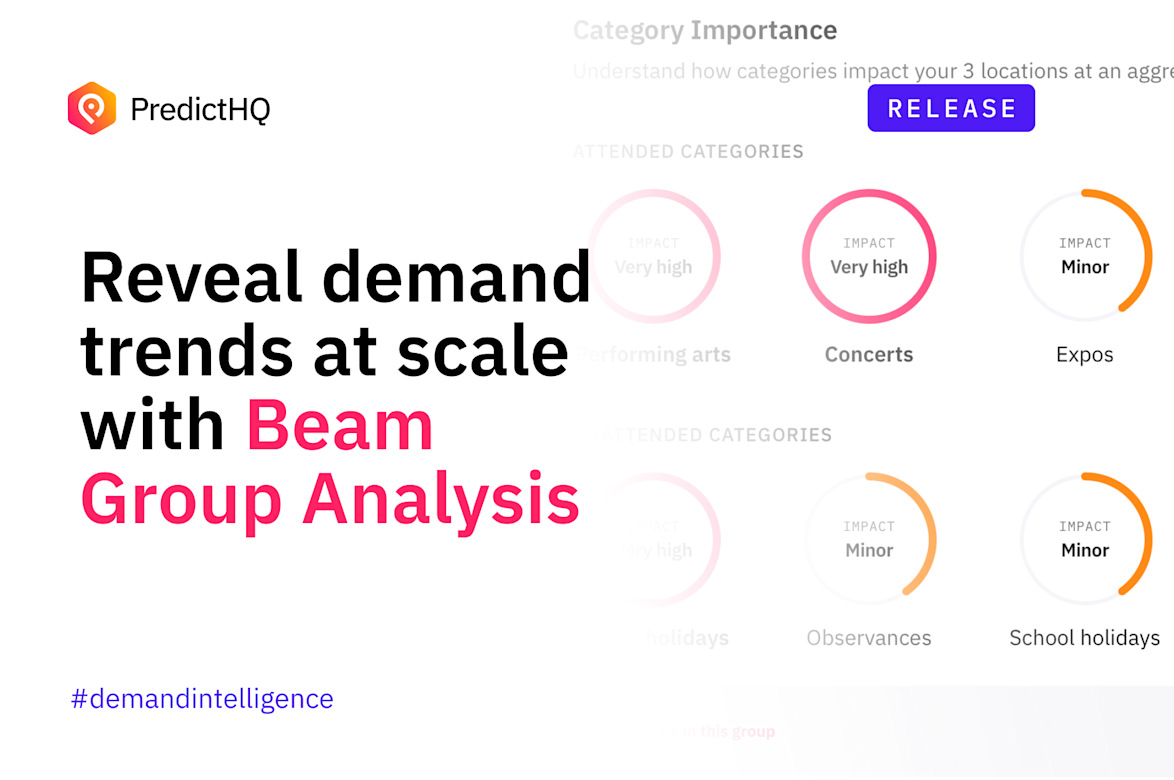
Leverage Beam to see which event categories impact your business most

Beam is PredictHQ’s Demand Analysis Tool you can leverage to reveal the events that drive demand for your business. With Beam, you simply upload your demand data, and it shows you the correlation against events data, so you can see how events and what types of events have historically impacted your demand.
Beam has revealed actionable demand insights for companies across industries – such as a consistent spike in demand for skinny lattes to the tune of 140-190% over the span of multiple years for one San Francisco coffee shop.
Log into your account today to upload your historical data, and let Beam reveal the event categories that drive demand for your business – so you can start leveraging these insights to make data-driven business decisions.

New Location Insights API + the option to select event categories and custom date ranges
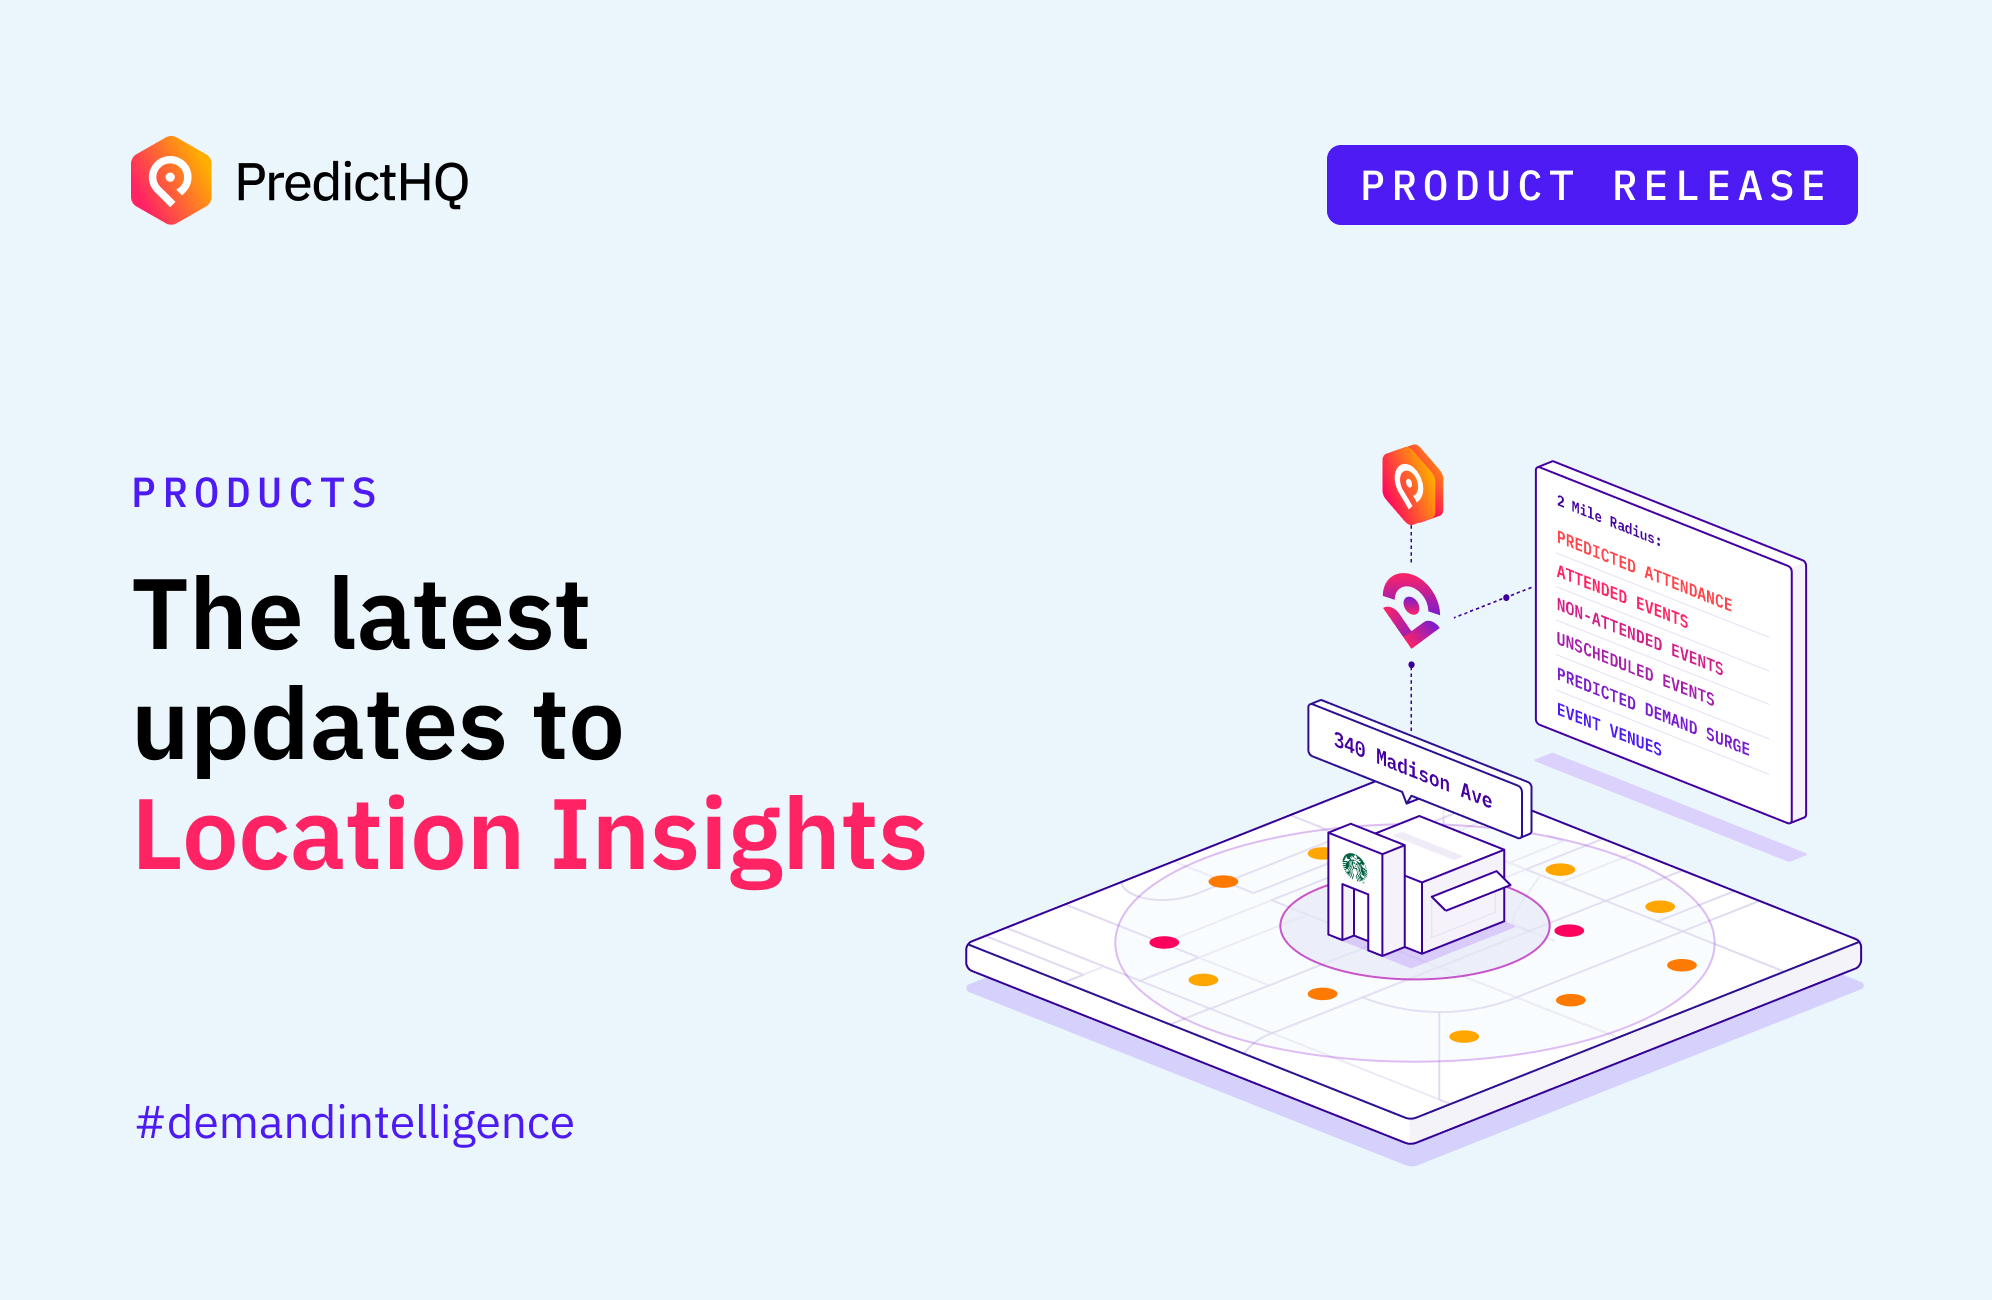
The location Insights API allows customers to create locations, edit locations, retrieve a list of locations, and retrieve all the events for a location all via the API. Essentially, it allows customers using the PredictHQ API to implement location insights features within their own application.
Plus, you can now select event categories and custom date ranges for your location pages – which filters the list of events shown in the map and list view to only show events in the categories and date range you select. These changes do not currently change the Location Insights stats. It simply changes what is shown on the map and events list.
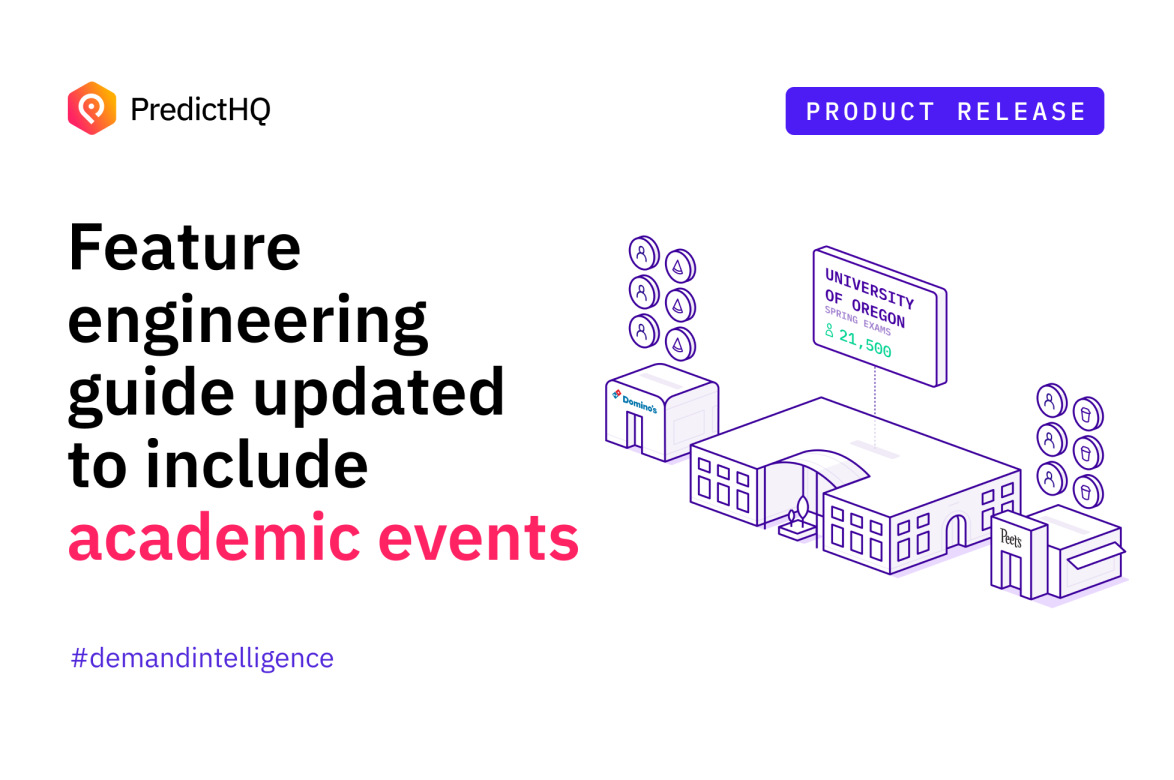
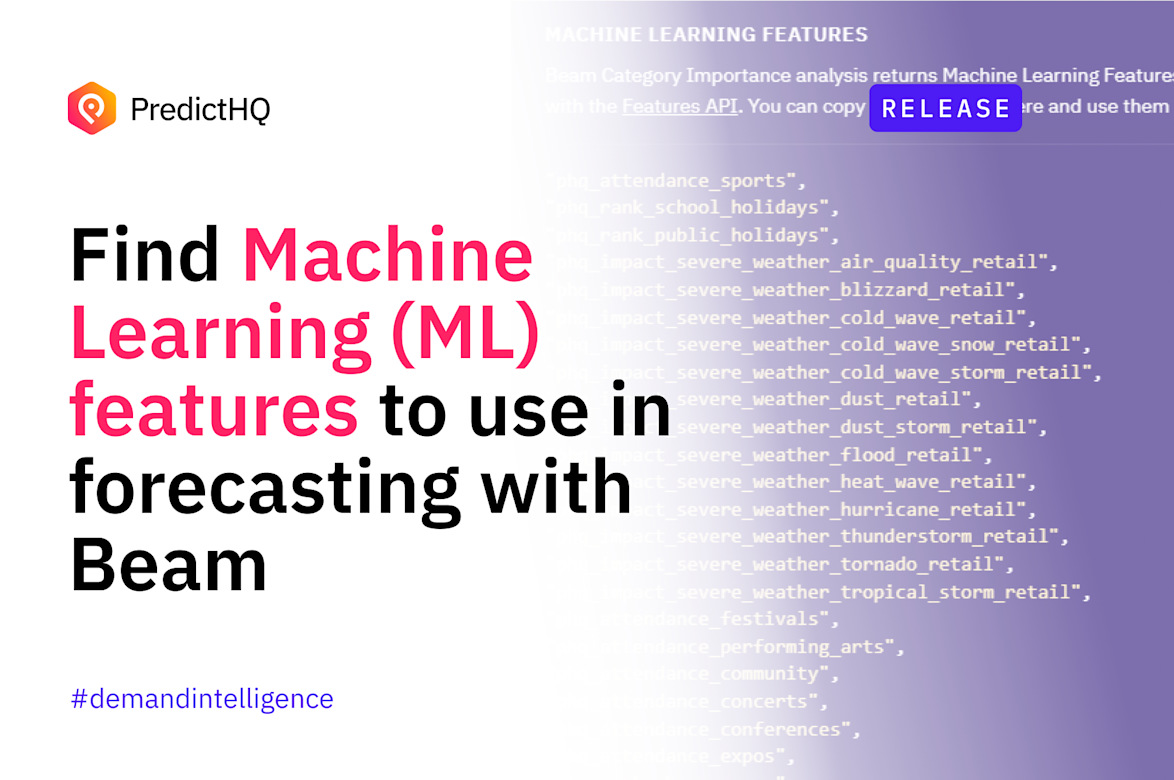
Feature Engineering notebook now includes academic events
The feature engineering guide was made to help you get up and running more quickly with our data, specifically our forecast-ready prebuilt intelligence and features of our event data that is accessed through our features API. This update extends this guide to include academic events.
PredictHQ tracks key academic event dates – such as graduation, exams, homecoming, and more – for every US college that has over 5,000 students. Learn more about the new pre-built machine learning features now available for academic events.

Want to dive deeper into these updates? Watch the on-demand webinar where PredictHQ Customer Experience Engineer Heath Blandford and Senior Data Analyst Jesse Ashton will show you the ins and outs of these new updates. You can also visit our Resources page to check out previous releases.