Take control of severe weather impact on your business with external intelligence

You can’t control the weather, or predict when severe weather will occur. But you can respond faster and more accurately with the right external intelligence. The PredictHQ team has been working on a set of features to enable QSR and retailers to do exactly that. Let me introduce you to demand intelligence for severe weather.
Almost every business tracks weather, which impacts demand. But consistent feedback we hear from our customers is that severe weather events drives the most impact and is the hardest to know how to handle, as it was near impossible to update forecasting models in an automatic and accurate way given limitations to existing data.
PredictHQ has always covered severe weather events, giving model-ingestible breaking updates on watches, warnings and events underway. These are updated every minute to ensure accuracy, but working closely with our retail customers we all realized companies needed a programmatic way to know:
Exactly where the events were impacting
What kind of impact these events will cause ie the severity and the duration of impact
And these needed to be model ingestible and explainable. When you work with some of the largest quick service restaurant chains in the USA like we do, you know they have so many stores that each need targeted, real-world aware forecasting that they can explain to their operations and store managers to build confidence.
Given the huge cost of severe weather, the fact (unfortunately) severe weather events are increasing in frequency and severity, and the millions retailers could save with accurate, automated updates if they had the right data - we decided to create it.
Key features that make PredictHQ's severe weather data forecast-ready
PredictHQ is the world’s first forecast grade and forecast ready severe weather data. It has three key components:
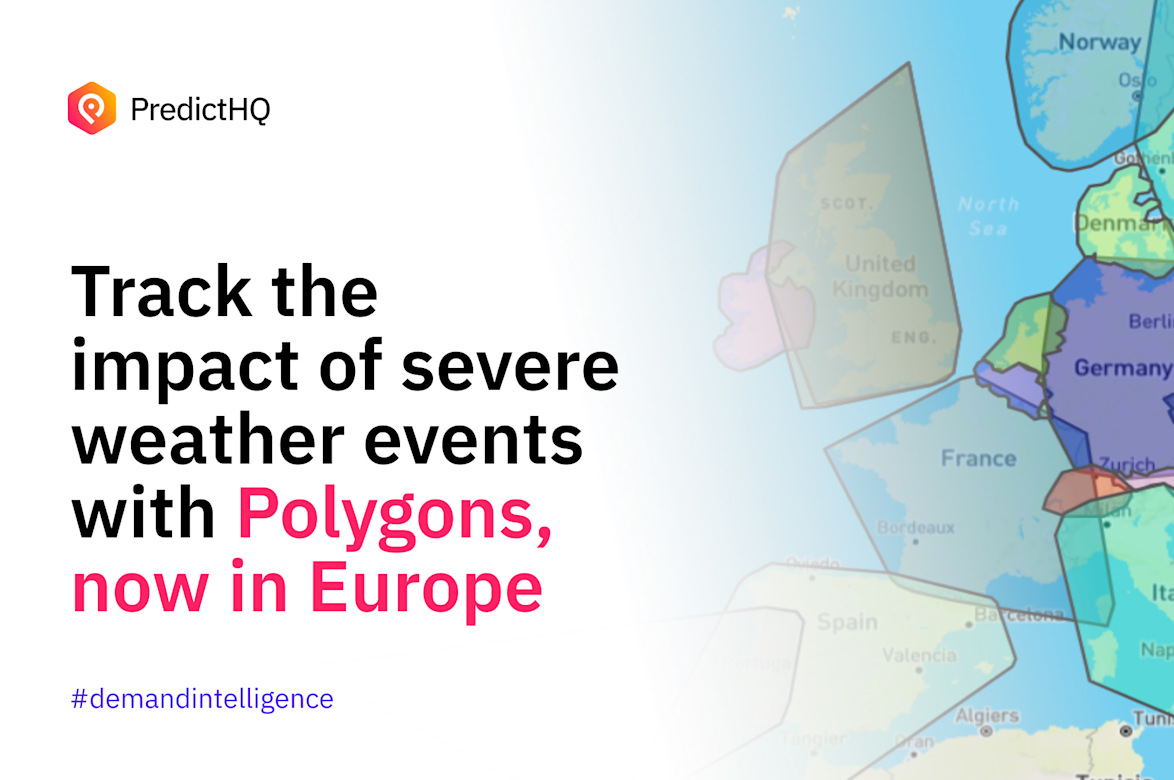
Geographical polygons that evolve as the information does, so you can know exactly which retail locations and supply chains are in the impacted area of the event.
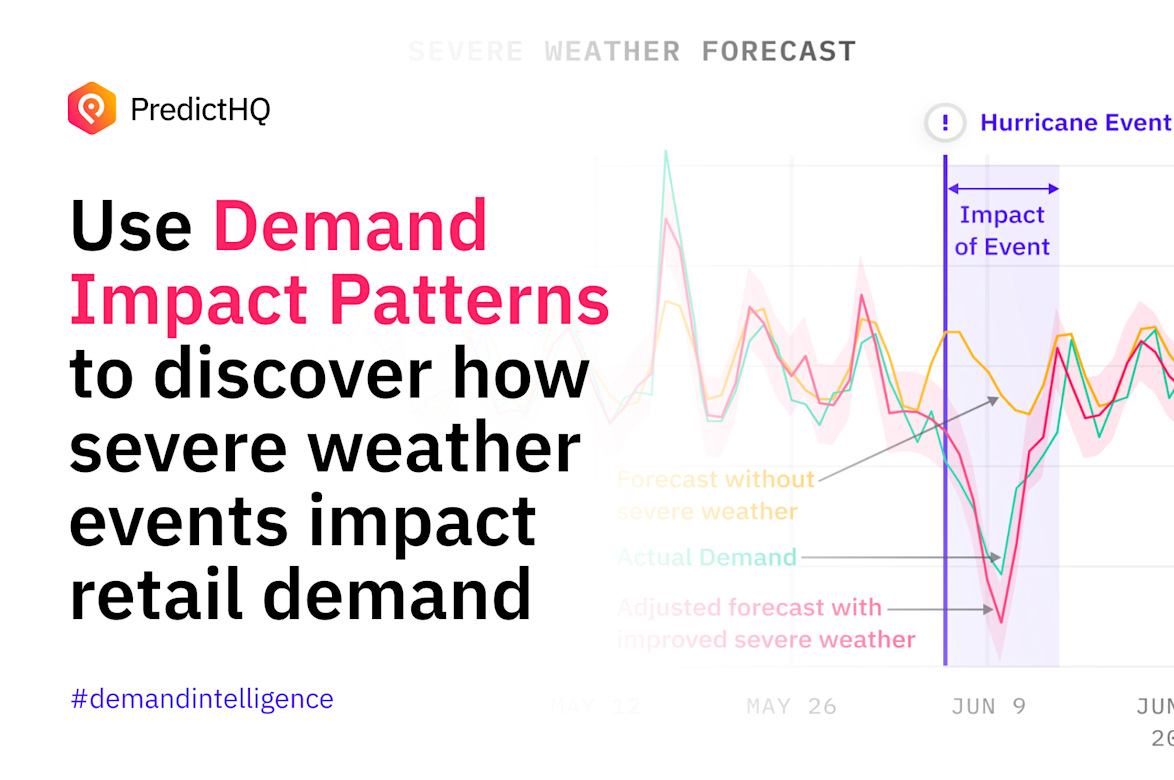
Demand Impact Patterns, which capture the severity of impact by day before and after the event.
A frequently updated and reverified pipeline to ensure accuracy and a robust API to deliver this information directly to models that can then automatically update forecasts and planning based on the most up to date information.
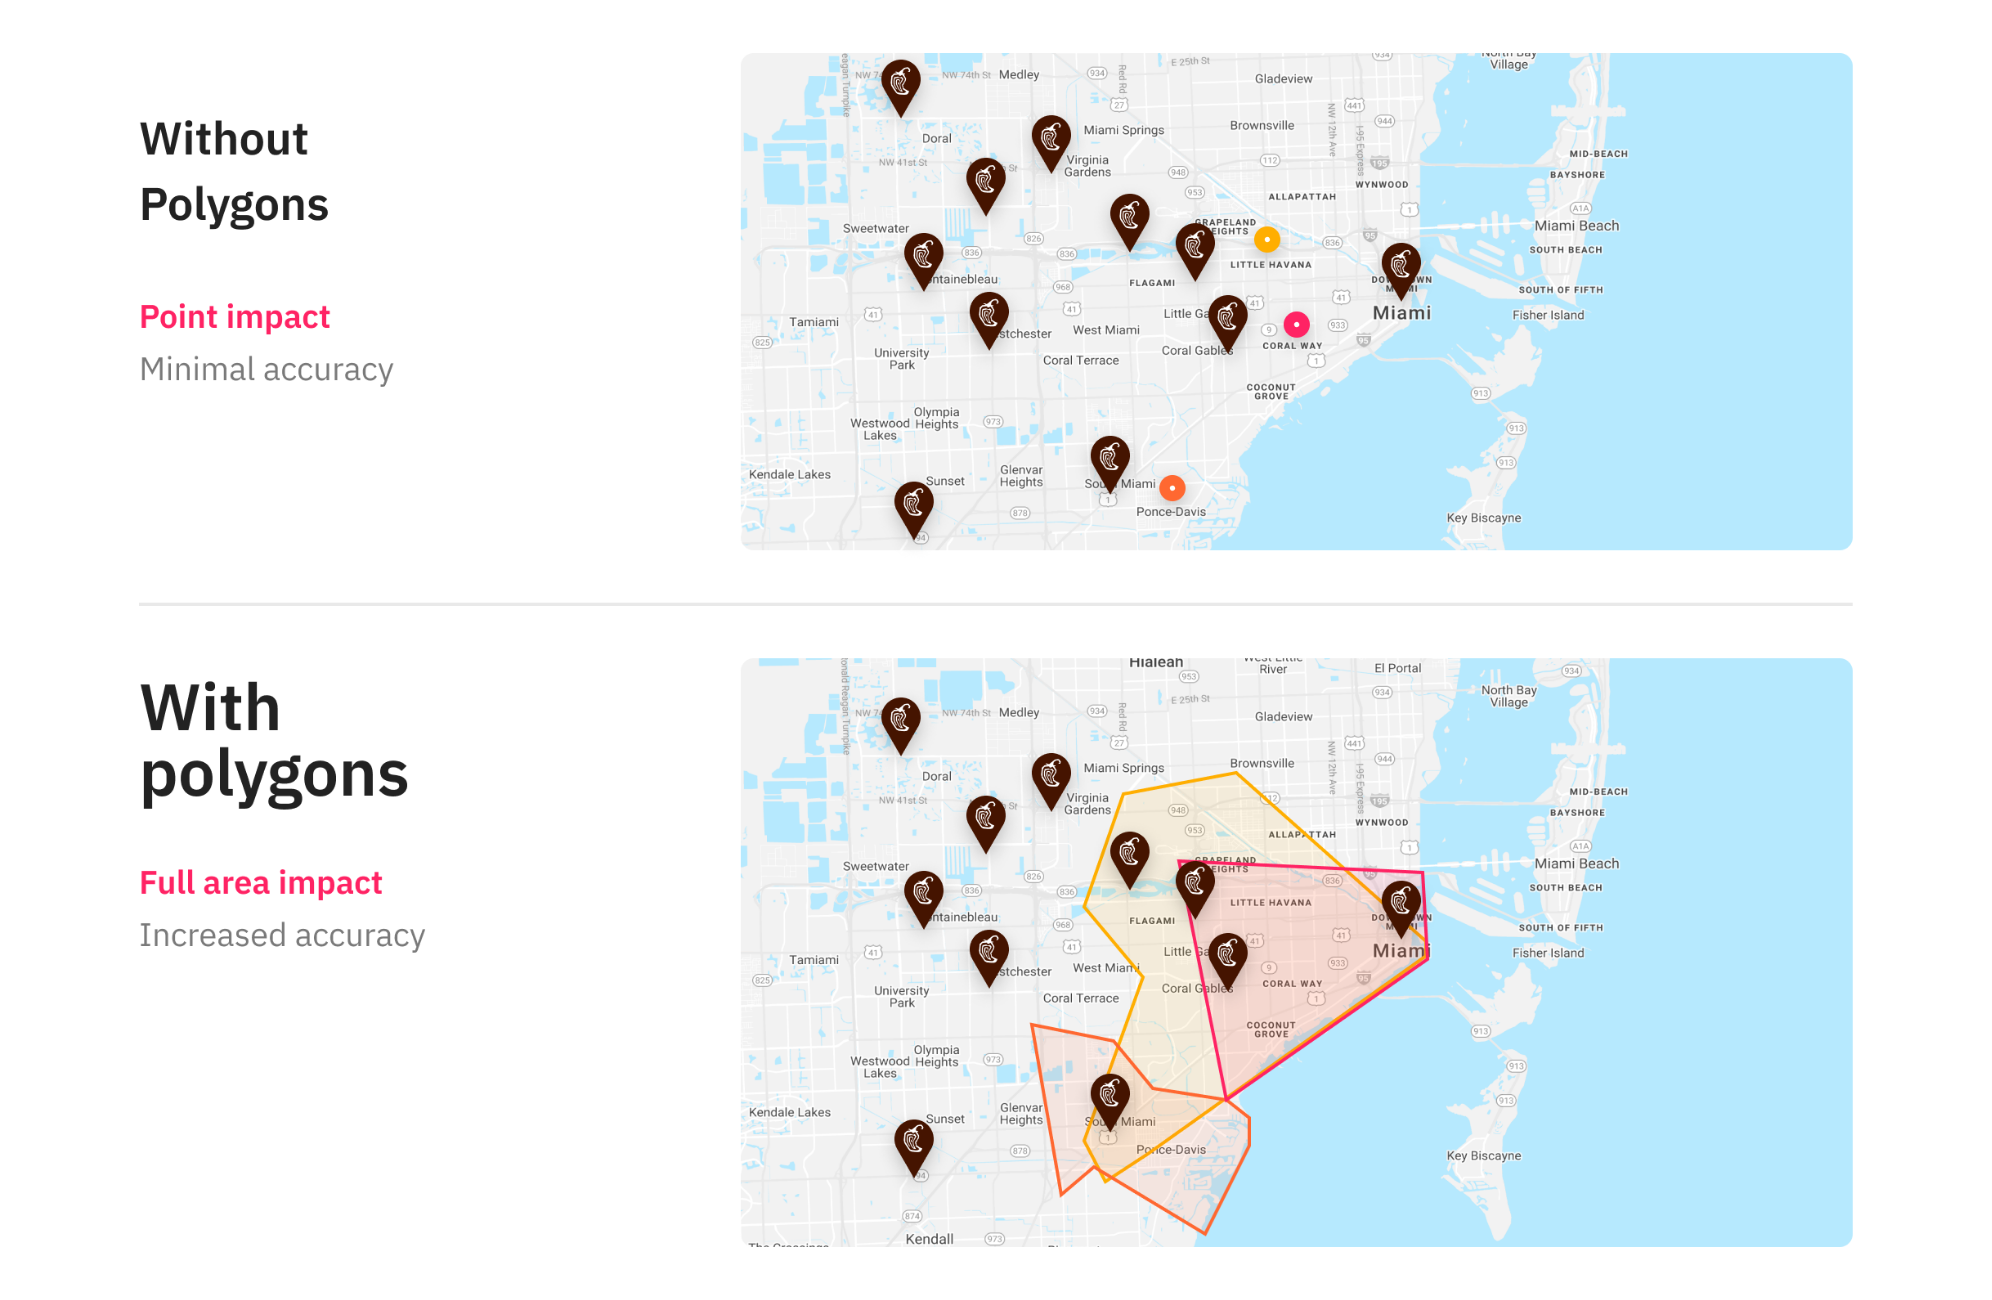
Polygons: know exactly where an event is occurring
Severe weather events don’t impact a city or state uniformly. Everything from floods to severe thunderstorms and air pollution and tornados all occur in distinct places, sometimes leaving neighboring suburbs almost completely unscathed.
Previously PredictHQ’s events were given a distinct geolocation. Most were occurring at a specific location or venue, so this worked well. We had built multiple systems to verify and enrich events based on its location and venue, and now we have built a more specific and accurate way to describe the location of more fluid events, starting with Severe Weather.
Just as storms, hurricanes and all severe weather events evolve, so to do our polygons as they are automatically updated to reflect the most recent and accurate information.
Polygons means that forecasting models or area managers can know swiftly which stores are the most likely to be impacted so they can:
Update staffing requirements, potentially reducing staff at stores likely to be affected, or shifting staff spend from front-of-house staff to delivery staff to match the surge in delivery orders many QSRs experience in poor weather.
Reallocate perishable inventory to stores that are less impacted by the incoming or ongoing severe weather, and potentially launch marketing campaigns to ensure minimal waste.
Consider which supply chains are likely to be disrupted to make informed decisions to limit the impact of this costly disruption.
More information and examples can be found here.
Demand Impact Patterns: the generalized severity and duration of impact of 73 severe weather events for retailers
Once you know where an event is predicted to impact, models need an indication of how long an event will have an impact, and how severe it will be on each impacted day.
Our chief data officer Dr Xuxu Wang explains the complexities of what she and her team have built in this excellent post. Our Demand Impact Patterns use complex machine learning models, learning from our massive historical severe weather data set as well as thousands of QSR and retail stores data. It identifies the impact on demand (both incremental and decremental) during the event, as well as the leading and lagging days and their impact.
It pinpoints the generalized demand impact for 73 kinds of severe weather. These include:
Floods
Hurricanes
Tornados
Severe heat
Severe cold
Heat wave
Hurricane
Severe Rain
Severe Sandstorm
Severe Snow Storm
Severe Storm
Tornado
Typhoon
Severe winds
Air quality
Blizzard
Cold wave
Cyclone
Dust
Fog
I know you’re probably thinking - that’s not 73 kinds of events. But that’s because within these events, there are distinct differences in impact patterns based on a range of factors including severity, location and the probability or frequency of the event in its location. Our Chief Data Officer Dr Xuxu Wang explains more about the complexities of the data science involved in this feature here.
Severe weather intelligence can drive major improvements to over and under-forecasting
What it means is models using our severe weather data will now be able to auto-update forecasted sales to more accurate totals for the whole period of time that is impacted - not just the day of the event.
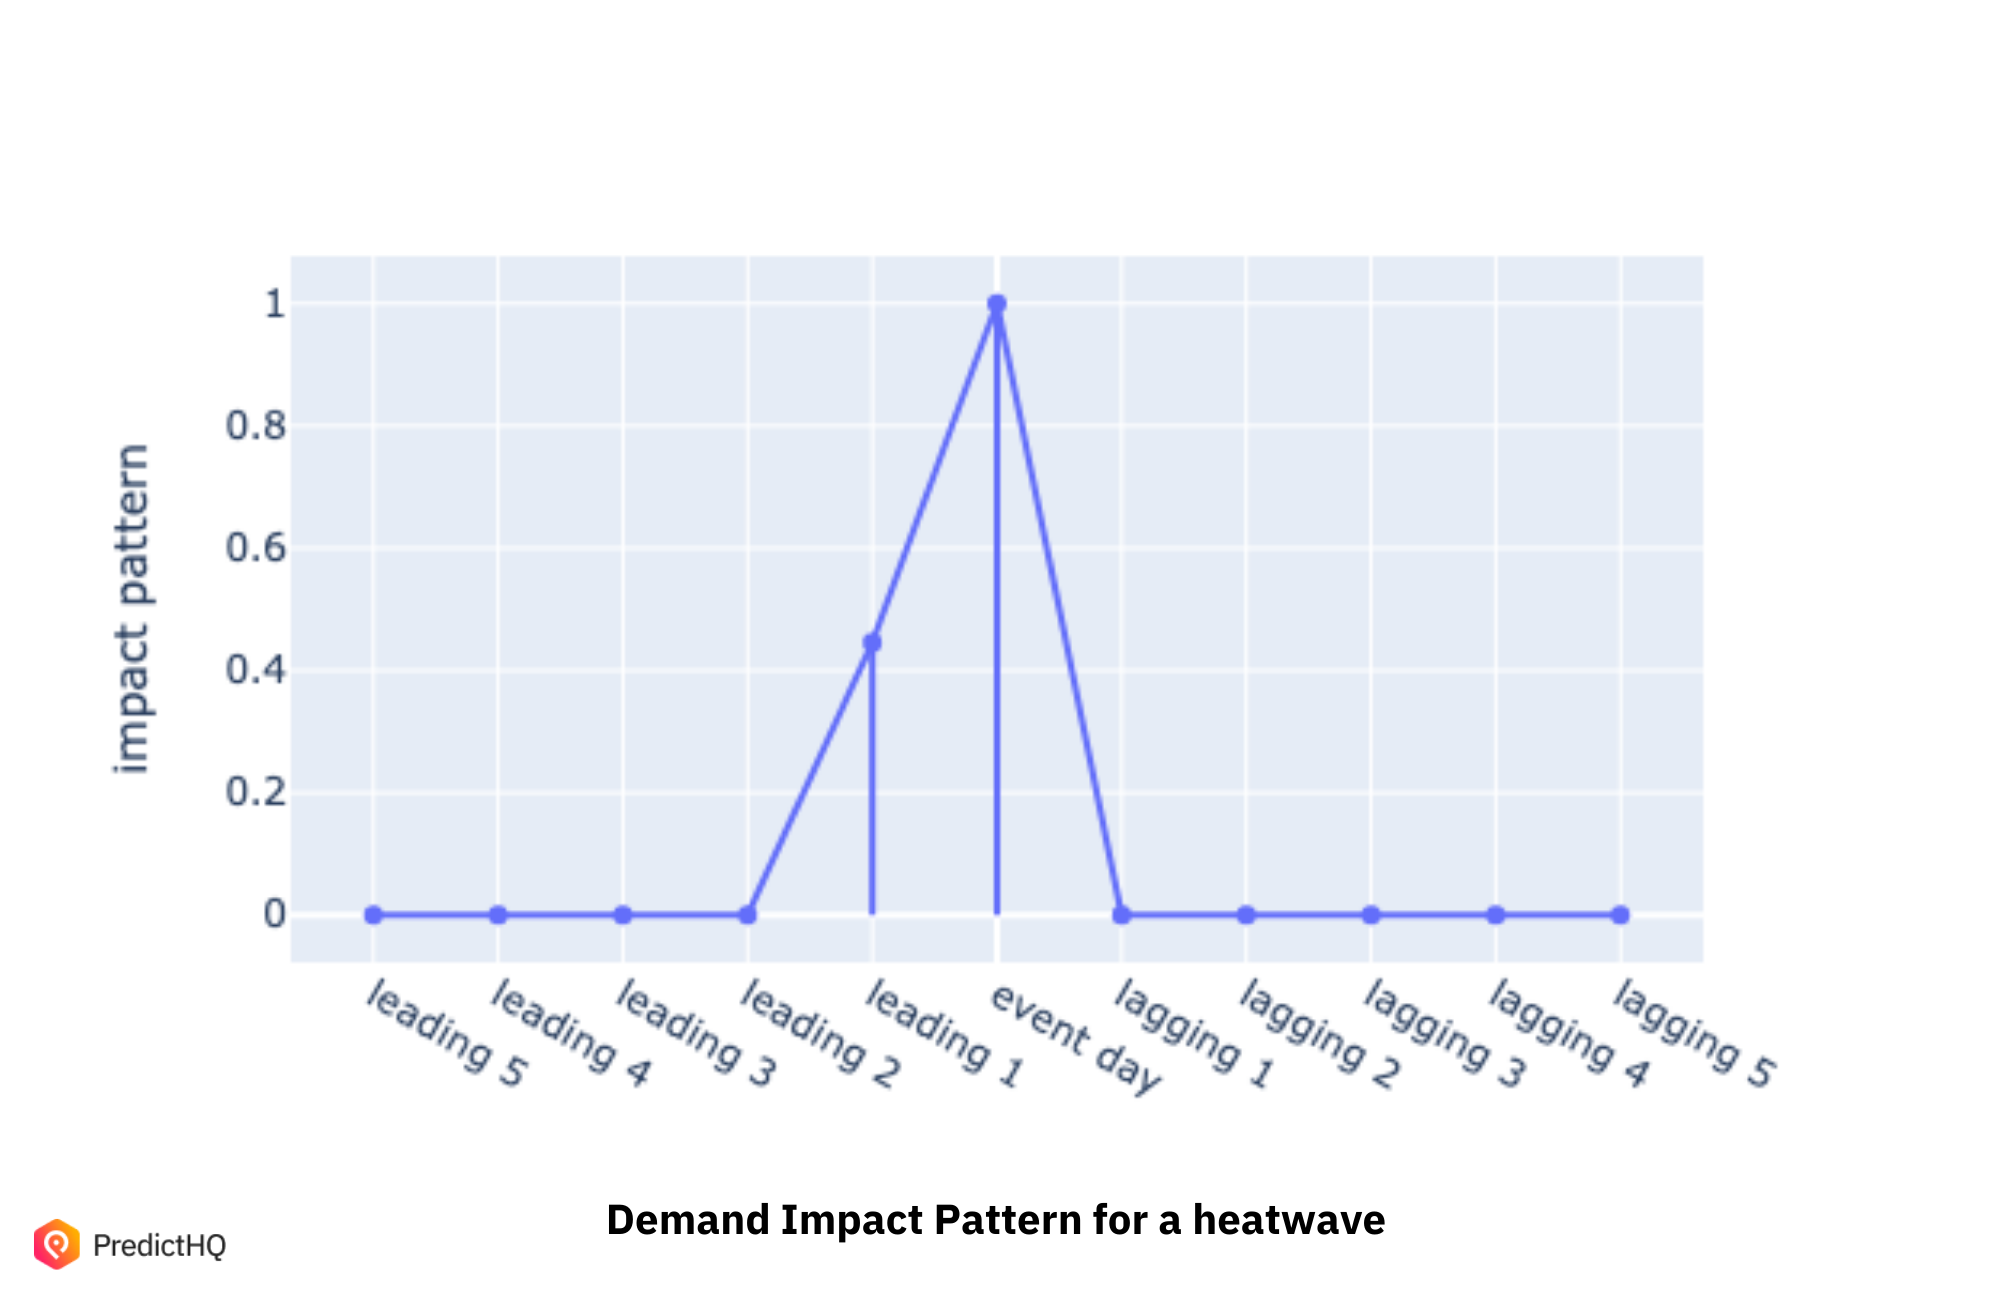
For example, below is a heatwave Demand Impact Pattern. As you can see, demand begins to be impacted in the days leading up to the event, as it gets hotter and hotter. This demand could be a drop off in burger orders in store, or a surge in soft drink and ice cream groceries ordered. It depends on the store, but the generalized Demand Impact Pattern enables your team to identify the impact for each retail location so your models can update accurately in advance.
To look at another example, an air quality index has a distinctly different impact, with higher impact leading and lagging days.
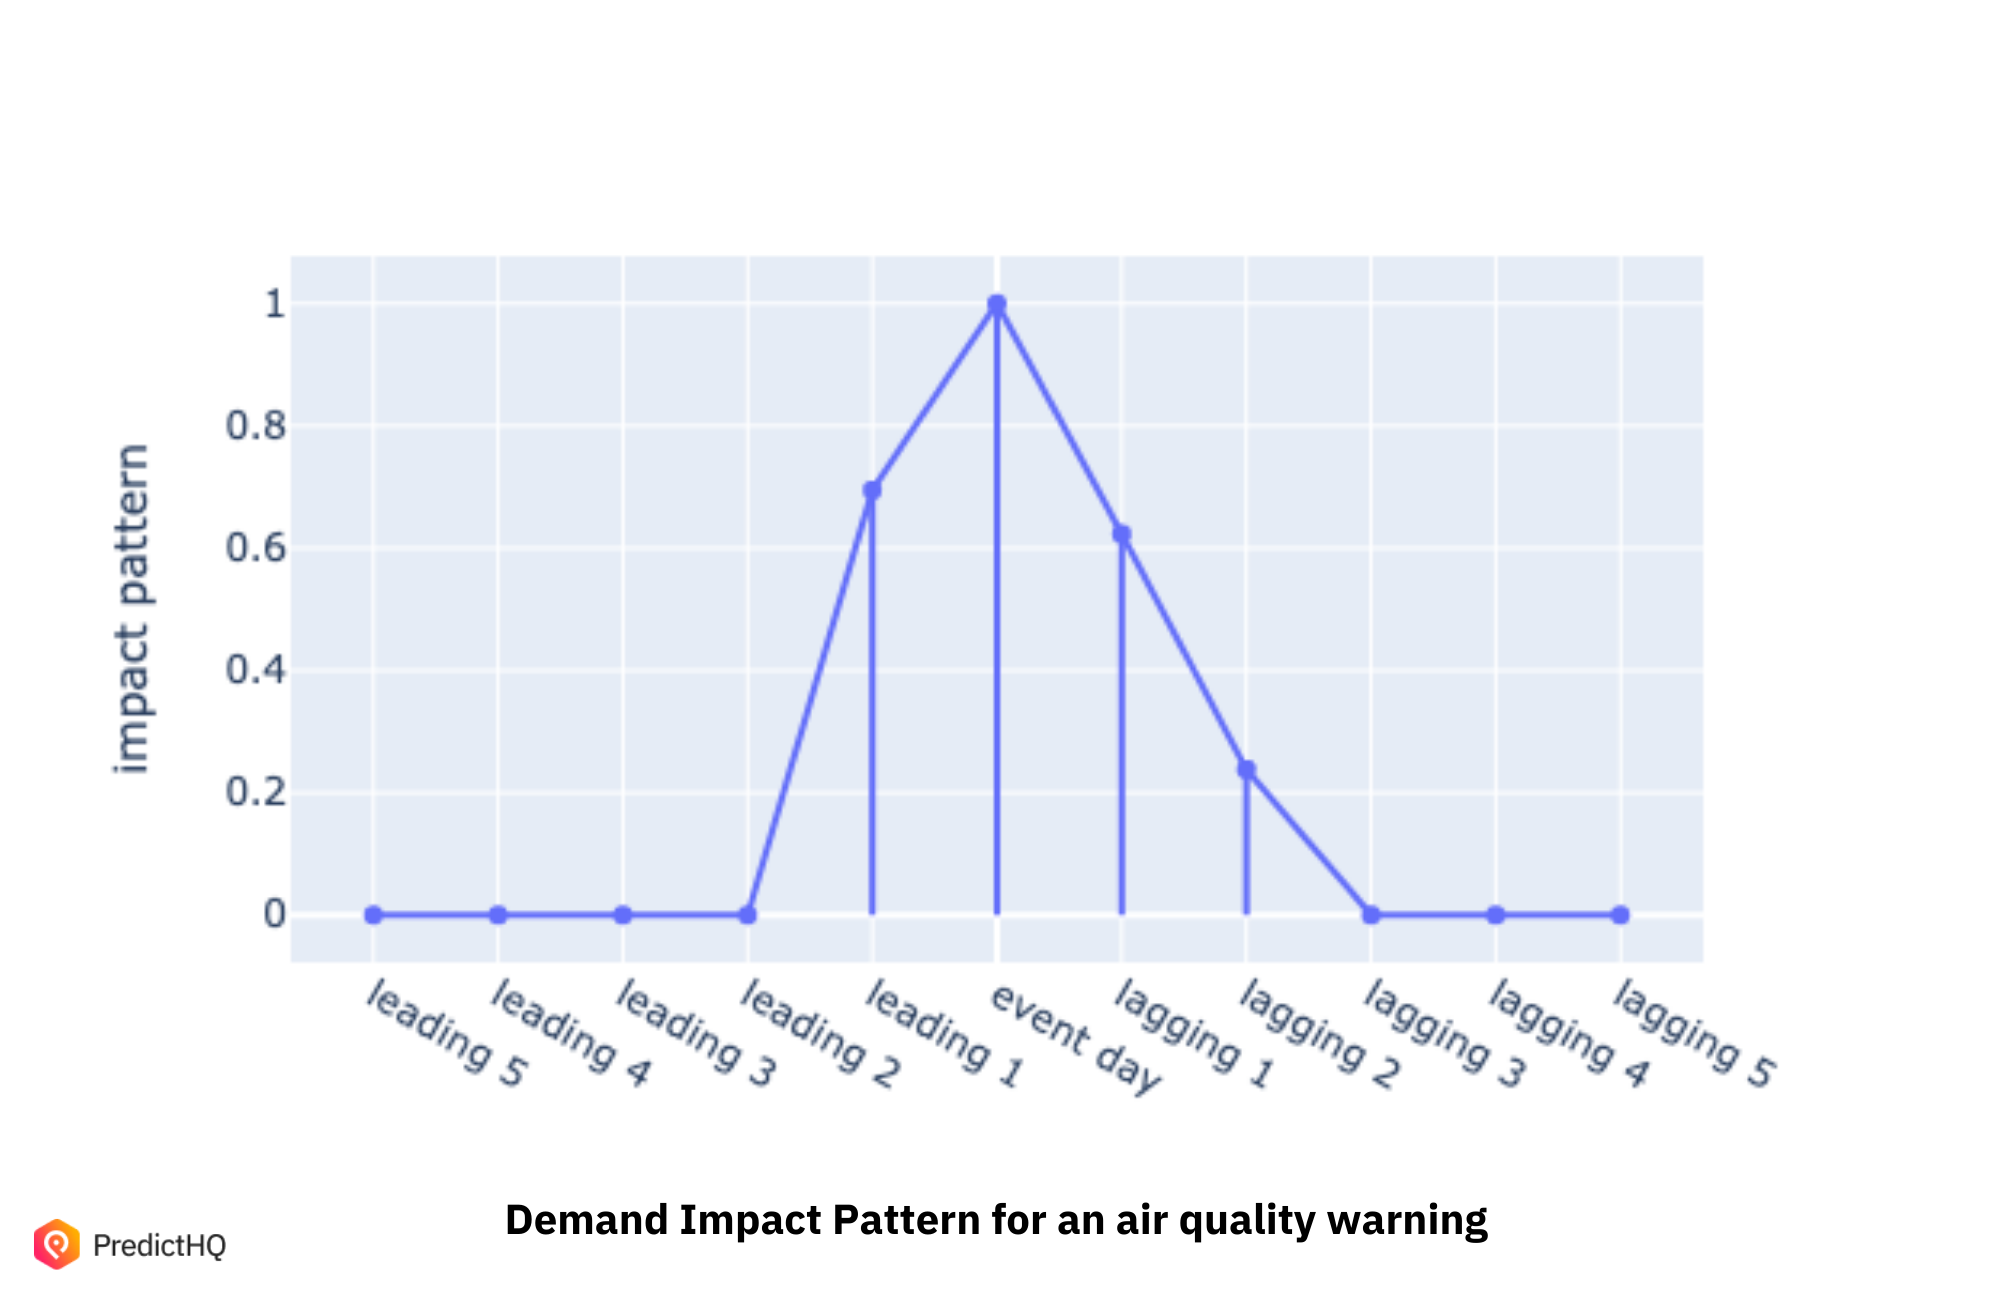
Understanding how these events can overlap using our polygons technology, say for a wildfire that starts in a heat wave and the air quality issues it generates, is a fascinating demand impact you can now unpack more accurately.
How to use severe weather events in forecasting
For most companies, the base demand forecasting is set weeks out from when a severe weather event would emerge. Yet companies can save millions each year by having more accurate, intelligent and timely forecast updates and adjustments when they factor in severe weather data like ours.
Whether it’s reducing staff, offering targeted marketing campaigns, redirecting inventory or updating supply chain routes swiftly, knowledge is power, and severe weather data enables you to take back control over the impact of severe weather for your business.
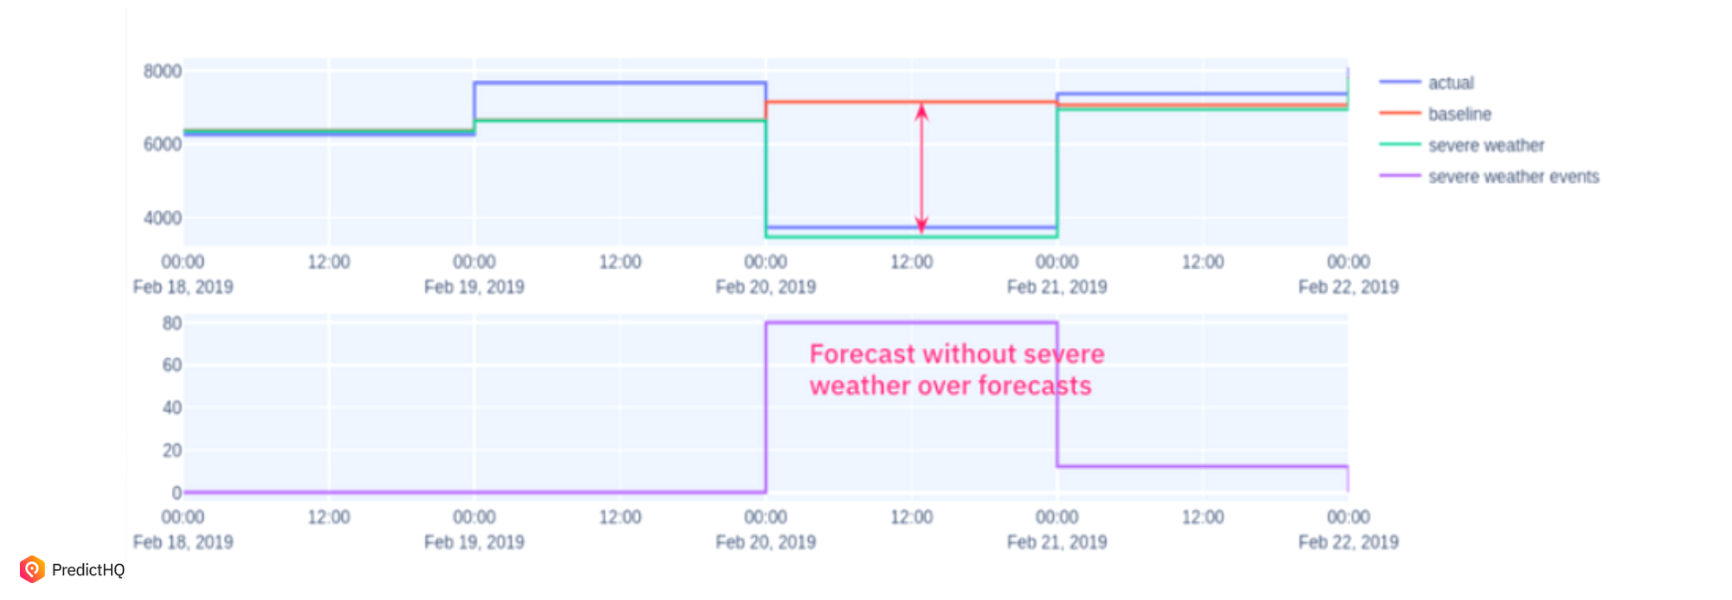
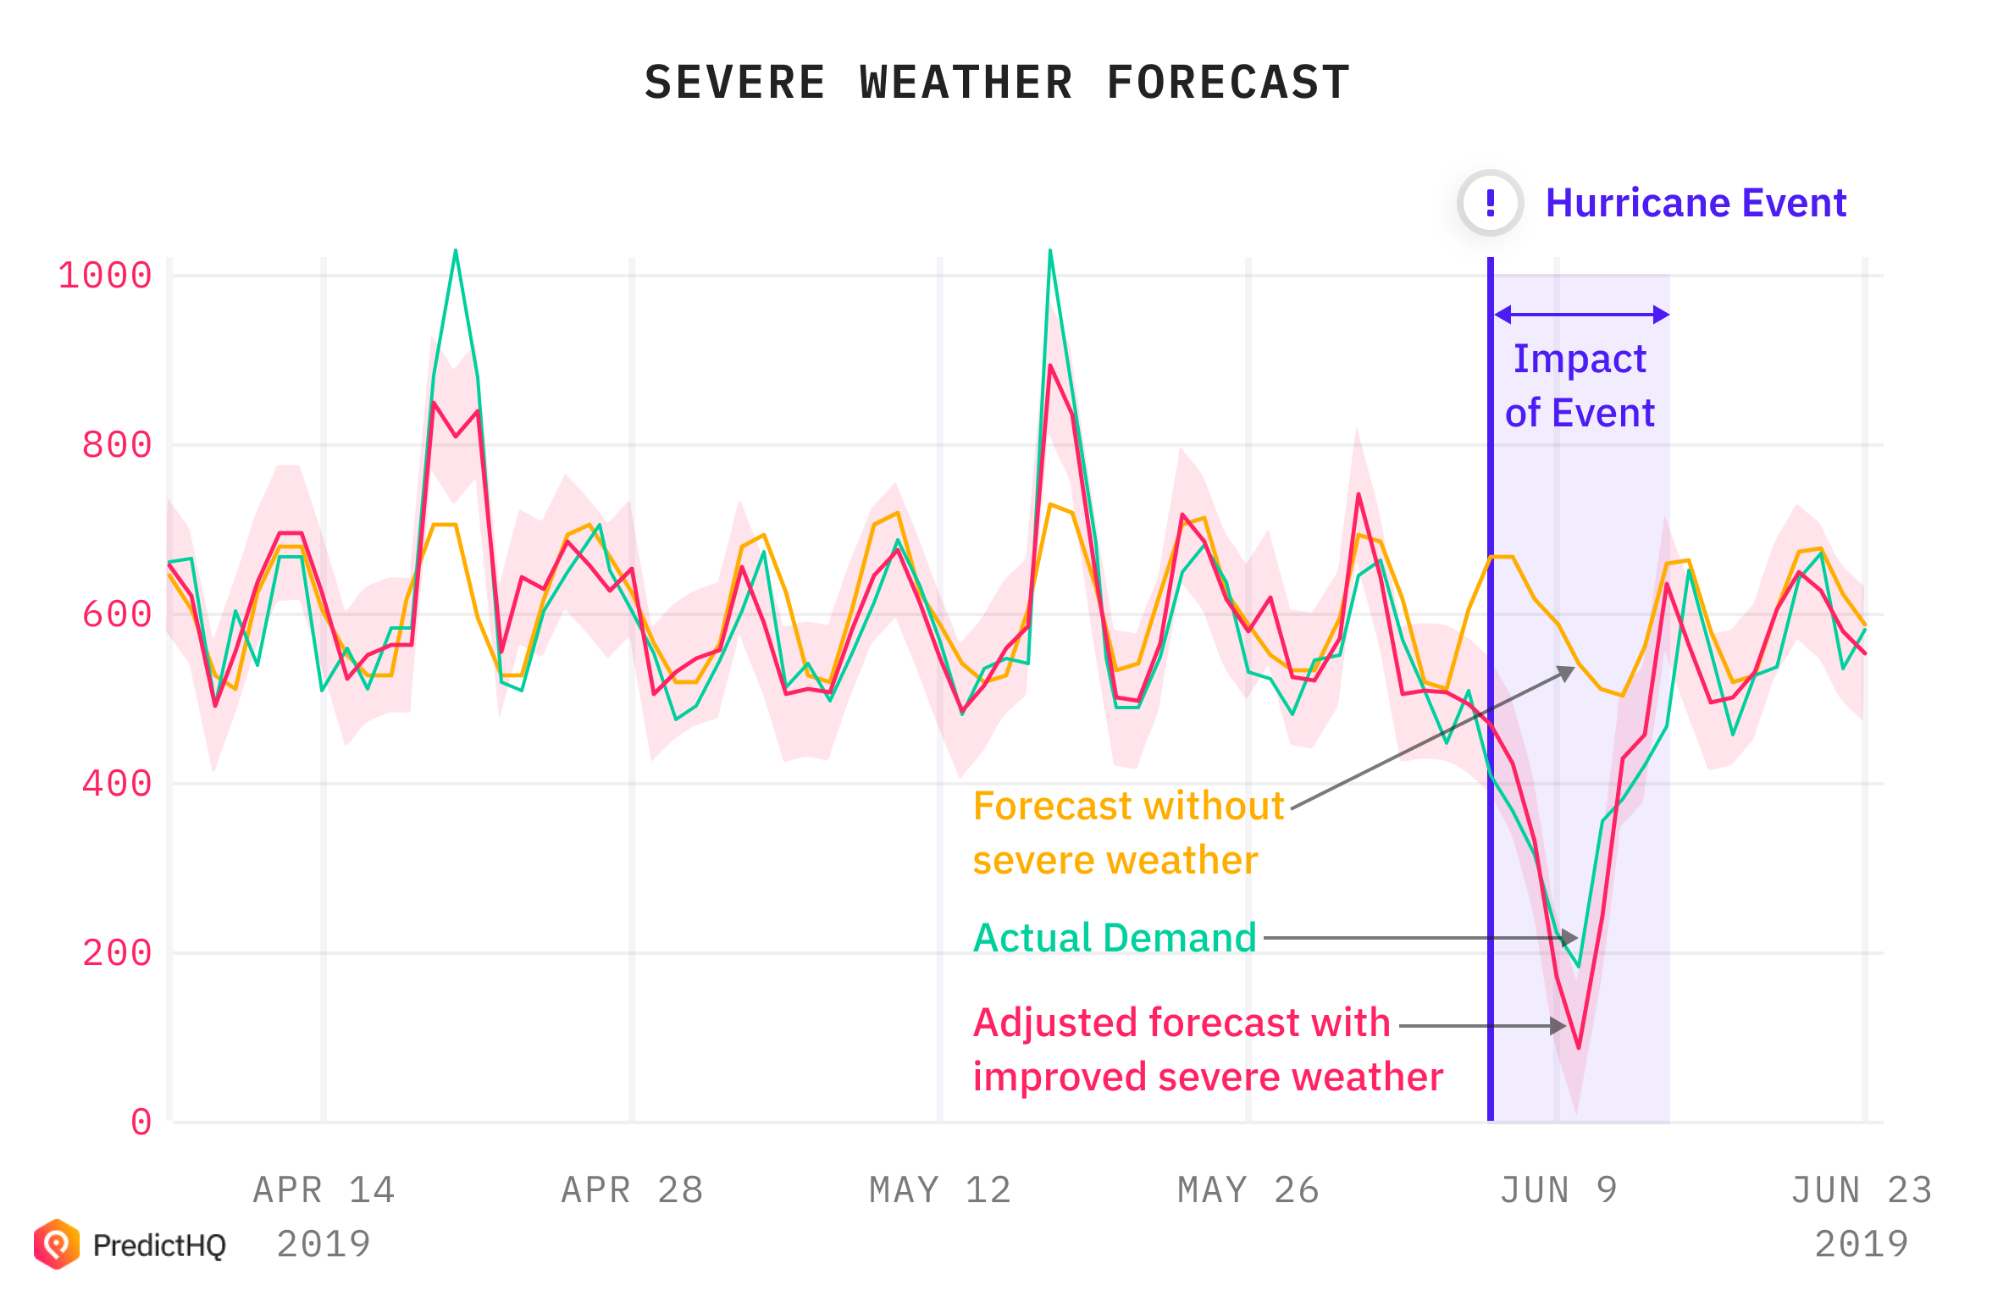
For example, above is a Winter Storm event in Maryland on 20 February, 2019.
Without severe weather incorporated into the forecasting model for a store in this location, it predicted around 7,000 units sold.
The actual demand was for ~3,700, a significant and costly over-forecast, wasting inventory and staff investment.
Using PredictHQ’s severe weather data, the model forecast ~3,400 units sold - much closer to the actual results when including severe weather in the forecast.
With more than 26,793 severe weather events in our systems for 2019, that’s a lot of over-forecasting companies don’t need to be losing millions to.
Get in touch with our team to start taking control of the impact of severe weather.