Data Science tools to use immediately

Demand intelligence is a new and evolving field. We’ve created Data Science documentation to help you get started with PredictHQ’s intelligent event data. You’ll find guides to using our API with common Data Science tools, libraries in Python, and code samples.

Not all events impact businesses the same way

We track 19 different event categories, each important in their own way

To start to get a handle on the data, we recommend starting with our attended event categories. This includes the following 7 event categories: sports, concerts, festivals, conferences, expos, performing arts and community events such as farmers markets and fun runs. These types of events have predicted attendance to work with and there is often a very clear correlation to impact.
Demo Videos

Watch Our Step-By-Step Videos

We’ve created quick videos for those of you who would prefer walking through the documentation with a PredictHQ specialist.

NEW: Features API Product Demo

Features API provides access to forecast-ready, prebuilt intelligence and features. Armand Naudé, PredictHQ Senior Software Engineer, will walk you through how to use the API endpoint. (3:09 min)

Live TV Events Part I: Data Engineering

Andrew Walker, Data Scientist at PredictHQ, will walk you through how to call the Live TV Events Broadcast API to extract data to a DataFrame. (14:36 min)

Live TV Events Part II: Data Exploration

This is part two of a three part series, where Andrew Walker, Data Scientist at PredictHQ, will guide you to explore PredictHQ's Live TV Events data. (18:23 min)

Get Started

Contact our data science experts to find out the best solutions for your business. We'll get back to you within 1 business day.
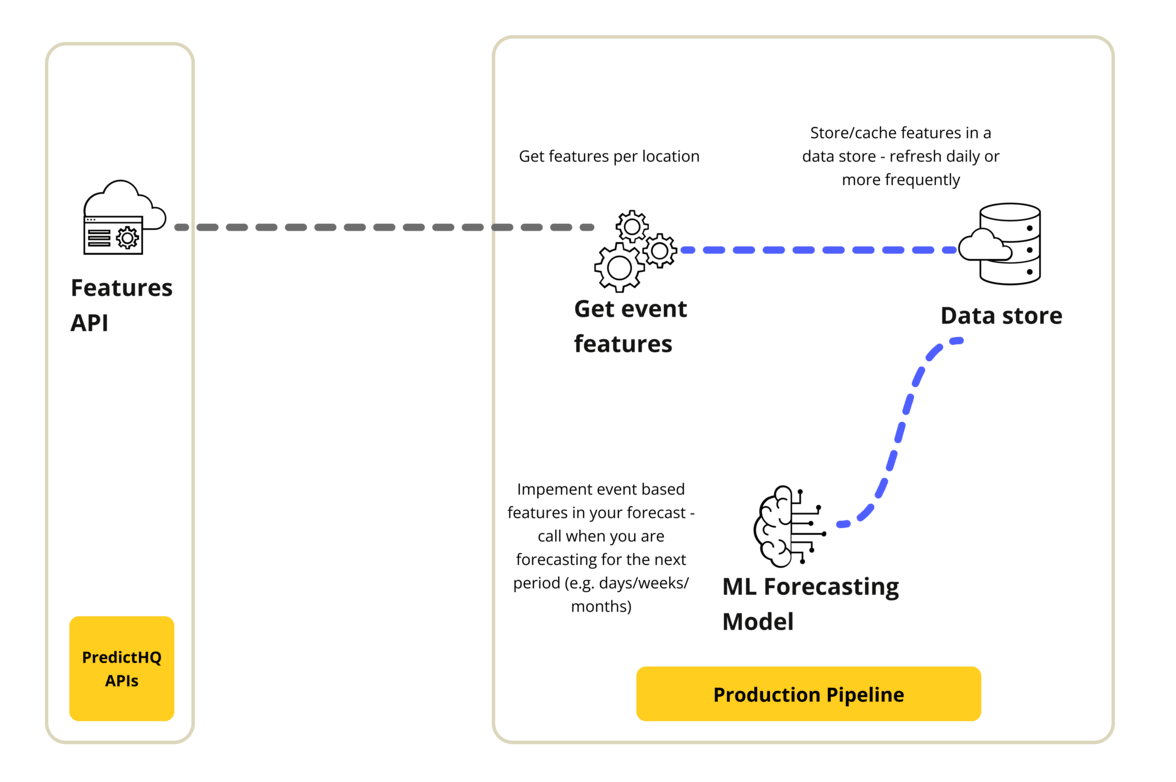
Talk to an Expert