Viewing the Category Importance information in Demand Analysis (Beam)
See which categories have the most impact
Demand Analysis (Beam)'s Category Importance feature uses advanced machine learning models to identify the event categories that have the greatest impact on your demand. This is done automatically after you create an analysis and upload demand data for an individual location. The results are a list of categories with a significance rating for each. The category importance results are for an individual analysis of the location you selected for Beam.
For example, restaurants tend to be highly impacted by sports and public holidays while hotels tend to be more impacted by conferences and concerts. By running category importance you can see how your business locations are impacted by events.
Category Importance covers the attendance and non-attended categories shown plus severe weather in the unscheduled category. It does not cover other categories not shown (such as disaster events).
Below is an example:
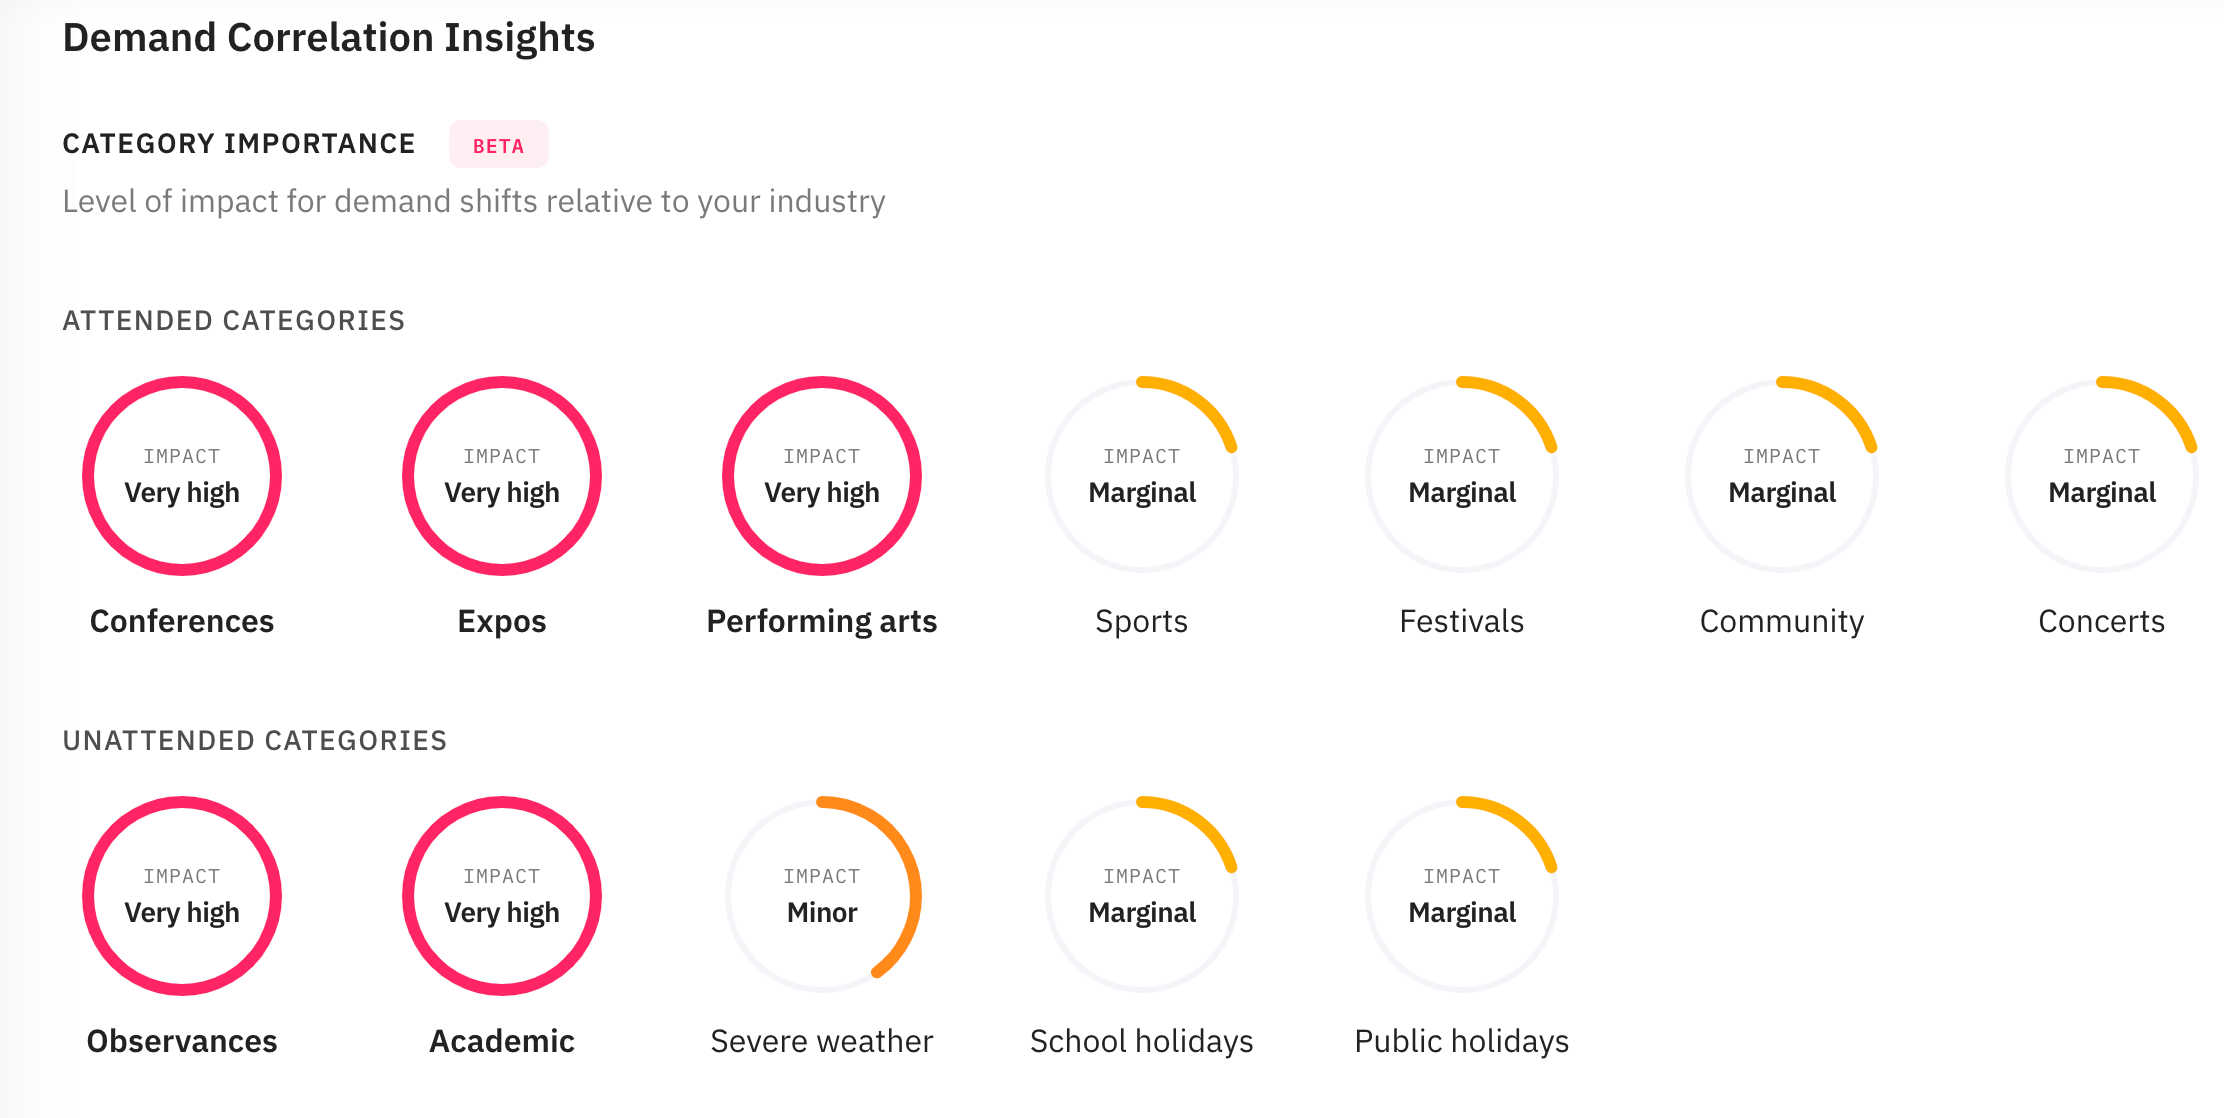
In this example, we can see a very high impact from conferences, expos, performing arts, observances and academic category events. The other categories have less impact on this location and as shown as "Minor" or "Marginal" impact. If a category shows a "-" then it does not have a statistically significant impact on demand based on the data uploaded or there are no events from this category taking place within the selected radius around the location.
You can use Beam to find out how different types of events are impacting your demand. If you are not sure what types of events impact your demand then create a Beam analysis with your demand data and look at the results.
Many customers use the Beam results to help decide what event-based machine learning features to add to their machine learning models.
Beam uses the Get Feature Importance API call to return sets of features related to important categories based on the category importance results for an analysis. Anything that you can do in the Control Center UI can also be done via the Beam API. Use the Beam API if you want to create a large number of analyses.
p-values
p-values represent statistical significance and we assign a readable label to each category based on it's p-value. There is a toggle to view as p-values for advanced users. This is intended for use by data science teams interested in digging deeper into the results.
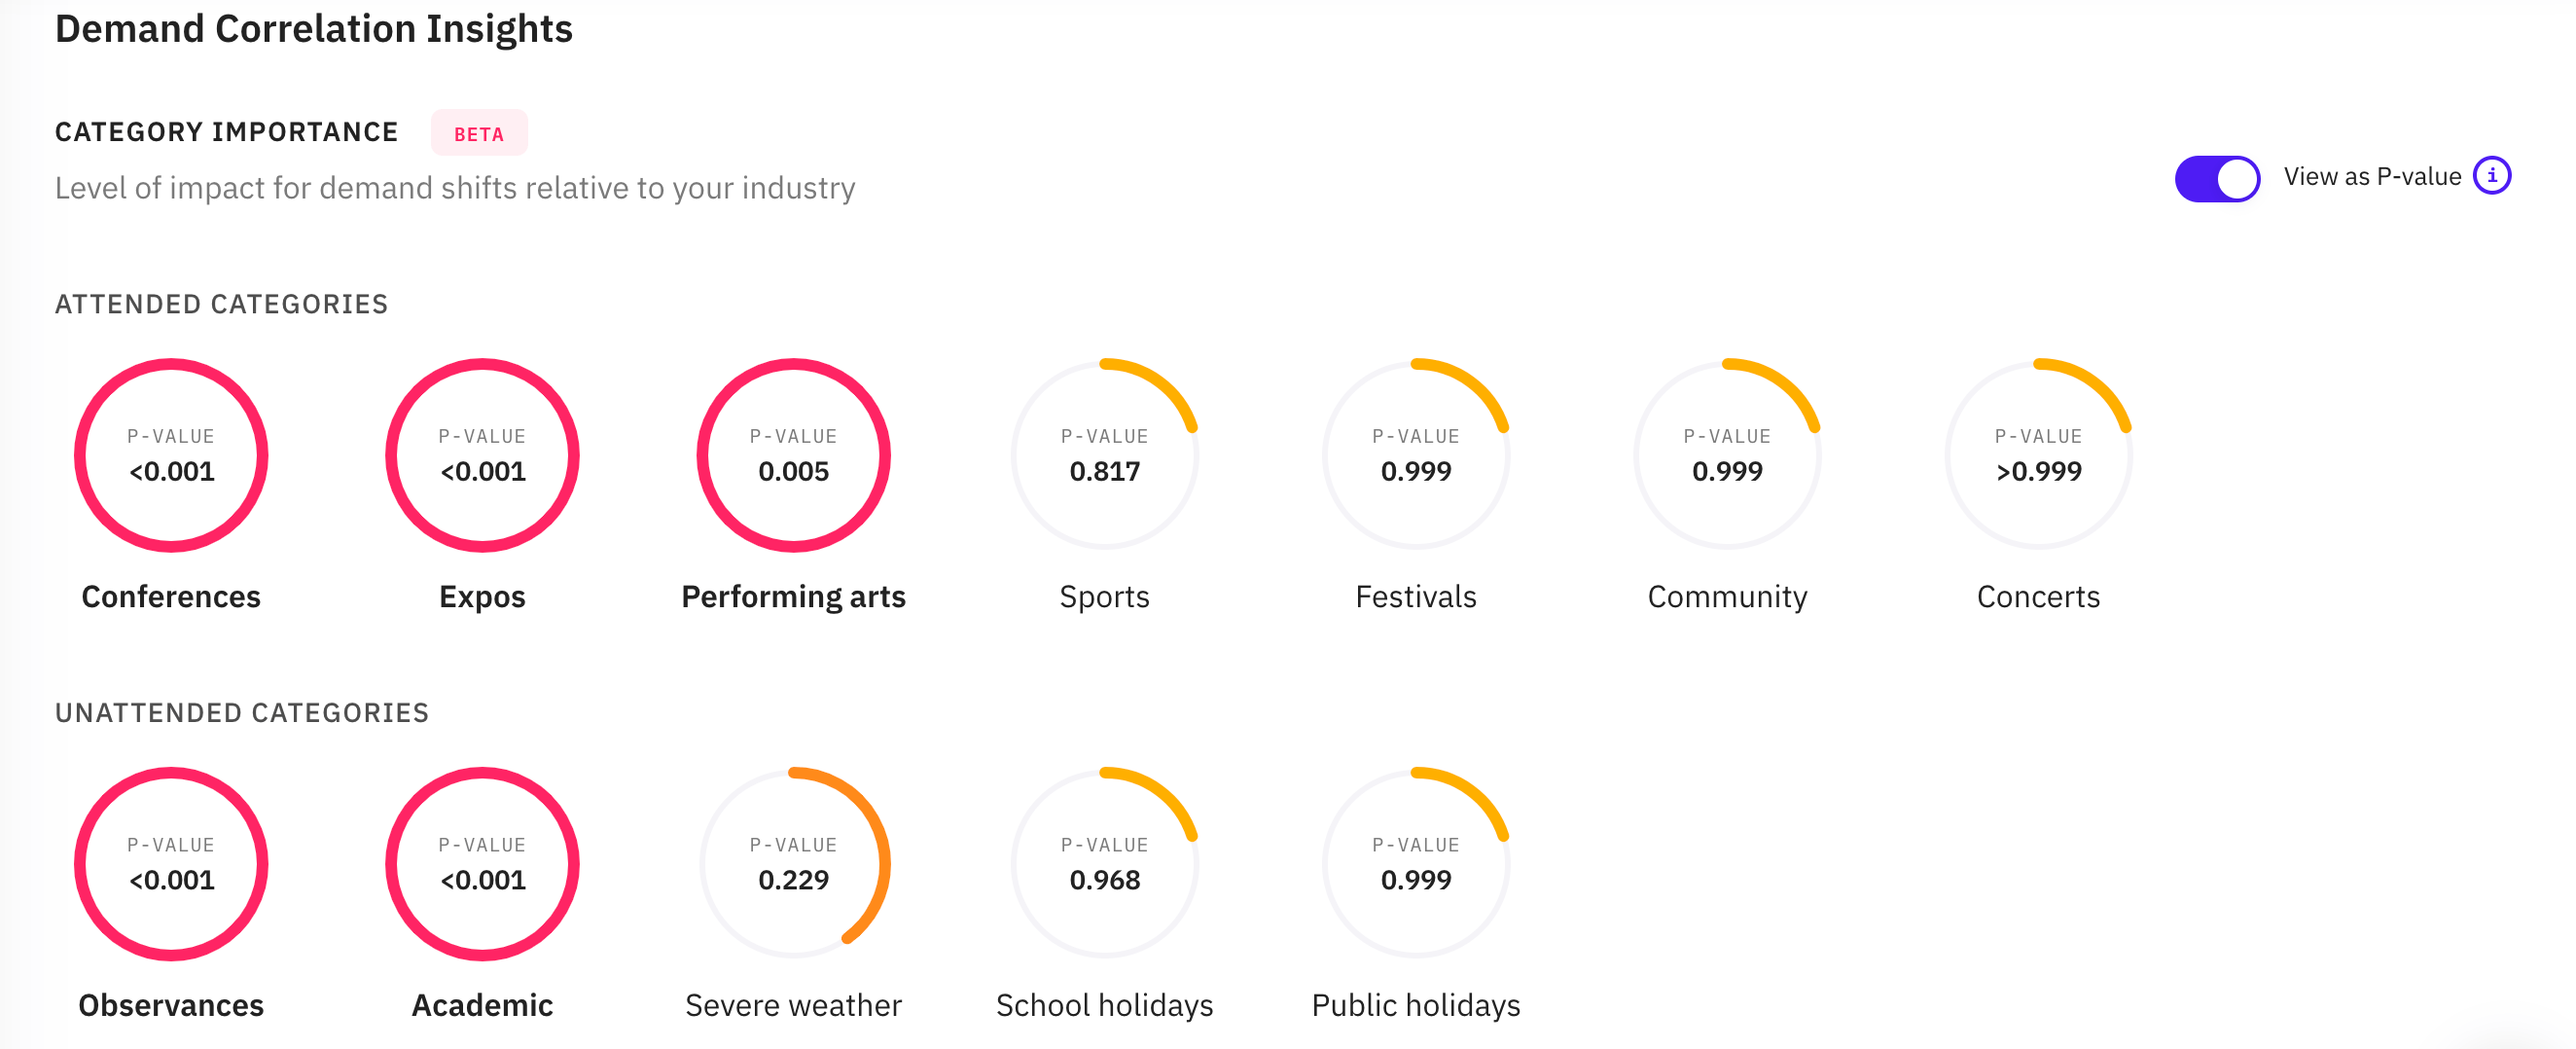
Note: very small p-values will be shown as <0.001. This can refer to results that are smaller than 0.001, e.g. 0.0005. A category that is considered to have no impact on the location will show a "-" label and no p-value will be shown.
The mapping of p-values to the impact levels shown on the Category Importance graphs is below:
0.6 ≤ p < 1.0 - Marginal
0.1 ≤ p < 0.6 - Minor
0.75 ≤ p < 0.1 - Moderate
0.05 ≤ p < 0.75 - High
p < 0.05 - Very high