Discover How Events Are Driving Demand with Our New Feature: Aggregate Event Impact


PredictHQ is built to solve the 11% problem: data scientists spend most of their time finding, cleaning and managing data and only 11% of their time creating and improving models.
We’re excited to announce a new feature that will drastically reduce the time investment by data scientists tasked with identifying demand anomalies in advance.
Aggregate Event Impact launched today. It enables data scientists to know the combined impact of all the events taking place in a location and time as a value, so it can be used in demand forecasting models. This improves the accuracy of your forecasting, meaning you can much more accurately forecast the impact of events on your demand.
It makes correlating your transactional data to events much easier, unlocking the ability to predict event impact on demand faster and more accurately.
What is Aggregate Event Impact?
Event data is dynamic and our impact ranking systems are unique. Users are able to search events by location, radius around a set point and predicted impact. But previously, the combined impact of events needed to be aggregated by each customer independently.
Our ranking systems assign a number between 0 to 100, based on the predicted impact of an event and are logarithmically scaled. This means summing up all the rank values of the events each day won’t produce a meaningful number.
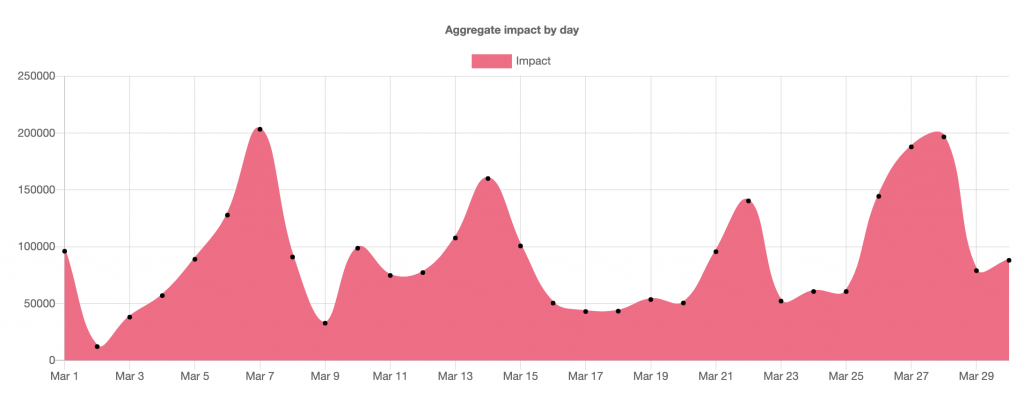
Here is an example showing a graph of Aggregate Event Impact for London. This is showing the total impact of all events in London over 2020 on each given day. Days with lots of high impact events will have a high Aggregate Event Impact value and days with less events have a lower value. Using Aggregate Event Impact you can filter on different event categories—such as Sports, Conferences, Expos, Concerts, Festivals or Performing Arts—to see the combined impact of events in these specific categories.
Previously, teams had to create their own features to arrive at an impact prediction for a location for a day or a week, whichever time interval they required. We kept hearing it was taking our customers weeks to update their models to do this, because of the complexities of event data.
Because our expertise is in how intelligent event data informs and transforms demand forecasting and pricing model accuracy, we have built this into our API. Now our customers can get an Aggregate Event Impact number for each day and location easily.
How to use Aggregate Event Impact in demand forecasting
Information on how to use Aggregate Event Impact can be found in our dev docs in the section on how to “Retrieve Aggregate Event Impact”.
Data science teams can match aggregate event impact data with their incremental demand data to find correlation. To do this we recommend you perform time series modeling on your demand data and extract incremental demand. This shows demand that is generated by external factors you are not currently forecasting. Then retrieve the aggregate event impact for each incremental demand day in your results. Matching up the incremental demand with the aggregate event impact allows you to see when your incremental demand is driven by events.
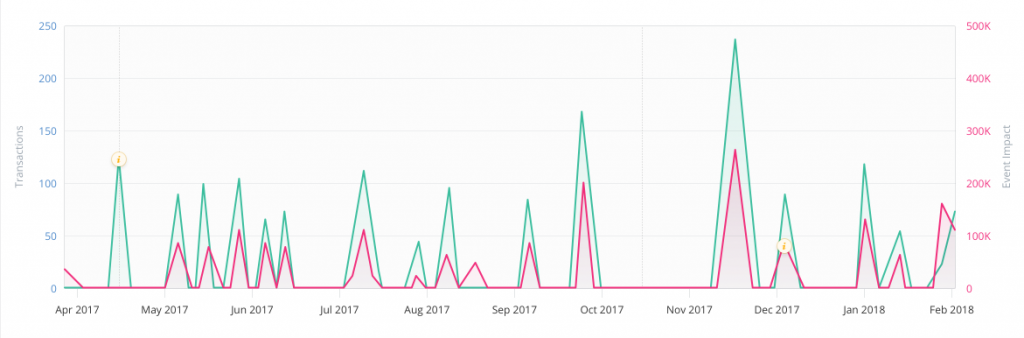
In the graph below the pink line shows aggregate event impact and the green line shows incremental demand. The correspondence between aggregate event impact and incremental demand reflects how events are driving demand for the customer. In this example you can see a strong correlation between events and demand.
This correlation is the fundamental step in opening up the world of demand intelligence. Some recent examples of correlation’s impact include:
An accommodation company quickly correlated their data and spotted a potential increase in a major city about to enter a perfect storm of demand and increased their nightly rate by 22%
A huge food retail chain unlocked correlation and saw that a major annual conference had significant impact on their demand. Using this one piece of knowledge they could turn event data into insights across many use cases – labor optimization, revenue management, marketing, footfall prediction, supply chain. The ripple effect from an event on business, cities and economies is significant.
Once correlation has been achieved, Aggregate Event Impact results can be used as a feature or multiple features in machine learning models.
It works as an input value for your demand forecasting models by indicating the impact of events in the area. For example, when you run a demand forecast for the next three months on a model trained to use Aggregate Event Impact, it will retrieve the event impact information from the API, pass that to the model and this informs the forecast, ensuring it takes into account the impact of events.
Under the hood when you call the API we are finding all the events in the specified location and determining the total impact of those events and passing that back to your model. Your demand forecasting may be particularly impacted by festivals, performing arts and sports events in your area. The impact results of the API will return the total impact for each category and your model can use these values.
For example one future day you are forecasting could have a major baseball game on, a street fair, an international film festival and the Symphony orchestra playing. The combined impact of all these events might result in a total aggregate impact score of 300,000 for a given city. Your model is trained to take this value and update the forecast based on the impact of the events and this could cause hundreds or thousands of additional transactions to be forecast if there is a high correlation between these types of events and demand in your model.
You can use this feature in your demand forecasting models to know in advance which days and locations will be your busiest, so you are never unprepared for a surge of demand again and are ready to go with tailored workforce optimization strategies, updated pricing models and inventory management plans.


