PredictHQ’s Demand Intelligence API

Access your demand causal factors in a single API. Breakthrough insight for more accurate demand forecasting, operational platforms, event calendars and much more.
  • Relevant + Intelligent

    Relevant + Intelligent

    It is impossible to predict demand anomalies without accurate historical and future-looking data. At PredictHQ, we have a strong focus on forecast-grade, relevant data for your business.

  • Expansive Global Coverage

    Expansive Global Coverage

    PredictHQ is the single source of truth with coverage across 18 categories (and counting) and global event data coverage from hundreds of sources.

  • Clean Event Data

    Clean Event Data

    Data scientists spend 40% of their time gathering and cleaning data and only 11% of time on data science. We do the frustrating work, so you can focus on what matters.

Aggregating Event Information

Remove the friction to more accurate forecasting

Events vary in impact and frequently cluster to create the perfect storm of demand. We aggregate and verify millions of events with the Features API, both historical and future, so data science teams don’t have to waste time searching and cleaning data. This is powerful context for your forecasting models that drives more accurate results.
    import requests
response = requests.post(
    url="https://api.predicthq.com/v1/features",
    headers={
      "Authorization": "Bearer $ACCESS_TOKEN",
      "Accept": "application/json"
    },
    data={
      "location": {
            "place_id": [ "5809844" ]
      },
      "phq_attendance_sports": True,
      "phq_attendance_conferences": True,
      "phq_attendance_expos": True,
      "active": {
            "gte": "2019-02-01",
            "lte": "2019-02-28" }
    }
)
print(response.json())
  
Rankings

Know which events matter the most, instantly

PredictHQ’s proprietary ranking technology systematically sorts through thousands of events each day to identify which will impact your bottom line the most. Focus on the events that matter with PredictHQ Rank™, Local Rank™, and Aviation Rank™.
    import requests

response = requests.get(
  url="https://api.predicthq.com/v1/events/",
  headers={
    "Authorization": "Bearer $ACCESS_TOKEN",
    "Accept": "application/json"
  },
  params={
    "rank.gte": "80",
    "local_rank.gte": "80",
    "place.scope": "5809844",
    "aviation_rank.gte": "50",
    "active.gte": "2019-12-29",
    "active.lte": "2020-01-10",
    "active.tz": "America/Los_Angeles"
  }
)

print(response.json())
  
Relevance

Use parameters to ensure relevant results

Filter the data with parameters such as Temporal Relevance to see if events happening sooner are most important to your business. Or see the events closest to your locations with Spatial Relevance.
    import requests

response = requests.get(
  url="https://api.predicthq.com/v1/events/",
  headers={
    "Authorization": "Bearer $ACCESS_TOKEN",
    "Accept": "application/json"
  },
  params={
    "q": "jazz",
    "country": "US",
    "category": "concerts",
    "active.gte": "2020-02-20",
    "location_around.offset": "5mi",
    "start_around.origin": "2020-02-20",
    "location_around.origin": "40.782409,-73.971885"
  }
)

print(response.json())
  
Placekey

Use Placekey to combine POI data + PredictHQ intelligent event data

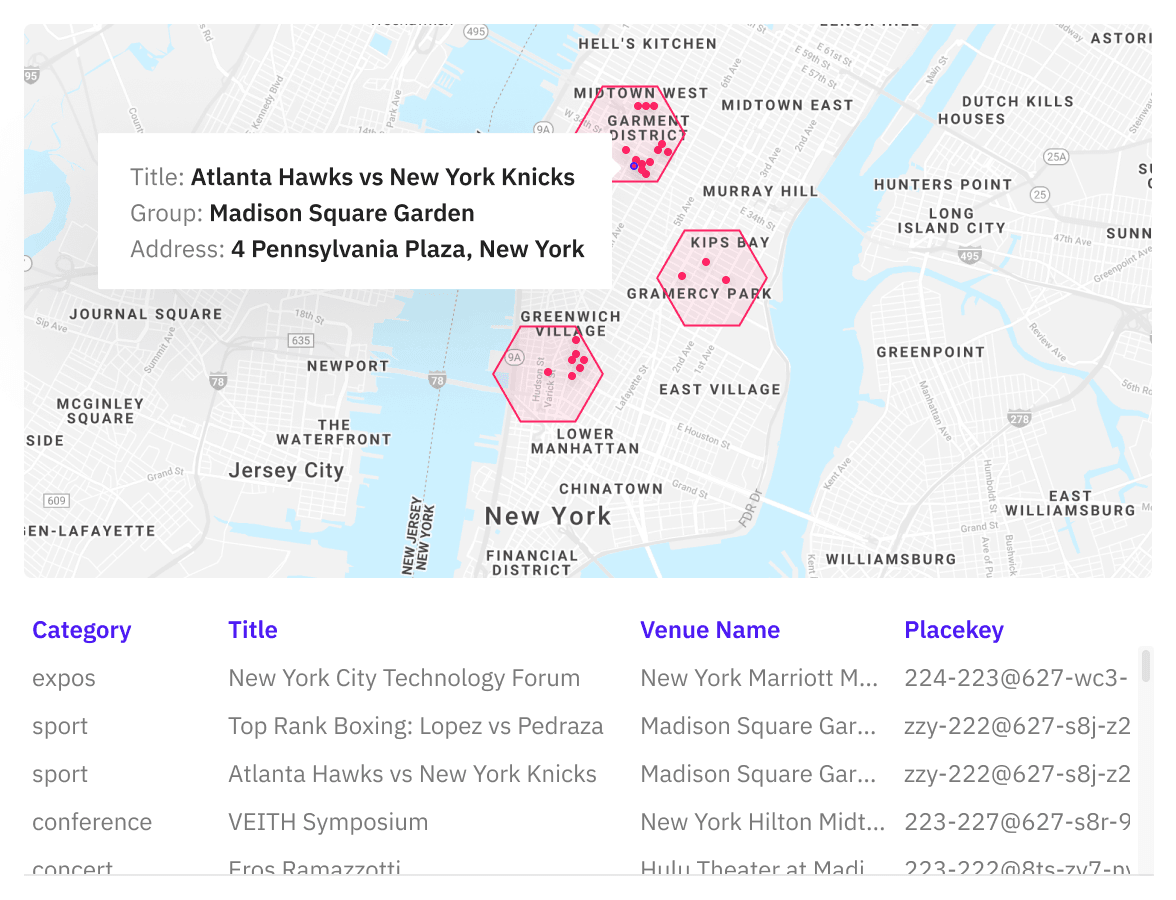
Placekey is a free, universal standard identifier for any physical place that makes it easy to join datasets together. PredictHQ provides Placekey via our Events API, Snowflake or AWS Data Exchange, so you can quickly join our intelligent event data to other datasets. For example, you can easily join PredictHQ’s intelligent event data with Point of Interest (POI) data to use for site selection, competitive intelligence, trade area analysis, urban planning and more. The combined data sets provide even further granularity and precision by clarifying exactly what is driving demand at a location. Interested in learning more about this use case? PredictHQ partners with Safegraph who provide a comprehensive high quality set of POI data.

Create a new access token via API clients

All API features

PredictHQ's Demand Intelligence API features were built to expedite your forecasting and unlock revenue opportunities for your business.
  • Radial search
    Radial search
    Need to know events happening within a mile of you? Use the "within" parameter to search for events happening within a certain distance of a specific point, such as a hotel or retail store.
  • NLP Labels
    NLP Labels
    PredictHQ uses natural language processing (NLP) and machine learning to classify events into niche subtypes to better identify their exact predicted impact.
  • PHQ End Times
    PHQ End Times
    Some event data sources provide start times but none provide the end times for every event. This is critical for transport, delivery and ride-sharing companies that want to ensure drivers are at a location when an event ends.
  • Geocoded Events
    Geocoded Events
    Many of the events we aggregate are incorrectly geocoded or missing geocoding all together. Our systems ensure every event available through PredictHQ is correctly geocoded.
  • Umbrella Events
    Umbrella Events
    There are often many individual events within a single larger event. The single larger event is called an umbrella event. Easily search and filter by overarching events e.g. a festival as the umbrella event and the individual performances under it. Some businesses are only interested in the umbrella event whereas others are more interested in the individual events under it. Sometimes perhaps both.
  • PHQ Attendance
    PHQ Attendance
    A numerical value that reflects the predicted attendance for supported attendance-based categories. The following categories are supported: concerts, performing arts, sports, expos, conferences, community and festivals.
  • Location search parameters
    Location search parameters
    Search, filter and analyze events in specific locations using latitude and longitude geocenter and radius, or by airport codes such as IATA, ICAO, UN/LOCODE. You can also search by country, continent, state, region, province, county or city using our Places API.
  • Recurring Events
    Recurring Events
    Many events recur but 85% of recurring events change location or date each time. By using recurring events, you'll have the ability to move beyond “we had a spike here last year” to pinpointing exactly why you experienced that spike and ensuring you can meet it again.
  • Directional Flow
  • Geographical place scope
    Geographical place scope
    Hierarchies are accounted for within our ranks with geographical scope e.g. events that occur at a country level vs. events that happen at a region or city level.

Customer Stories

Demand intelligence gets results

Our customers include leading companies across retail, transport, accommodation and financial service sectors. They use our intelligent event data for labor optimization, demand forecasting, dynamic pricing, supply chain optimization and more.
Don't underestimate how much effort it takes to work with event data... Being able to rely on a company whose sole purpose is to remove the ambiguity of event data has been game-changing for us.
Read Legion’s Story

Event impact insights for local and global businesses

Free Trial - No Credit Card Needed

Free

Explore future event impact on your staffing, inventory and pricing plans

$0

USD

/month

* Up to 2 locations, 2 mile radius

  • Web Application
  • APIs: Limited
  • Future Visibility: 3 months
  • Historic Visibility: None
  • Location Type: Radius only
  • Event notifications

This plan is ideal for:
Anyone wanting to try and explore our data.

Starter

Leverage customizable and scalable event impact data to drive growth

Starts from

$60

USD

/month

billed at $720 USD/year

  • Everything in Free, plus
  • APIs: All
  • Event categories: Add-on
  • Future Visibility: Unlimited
  • Historic Visibility: None
  • Location Insights: Unlimited
  • Location Type: Radius, entire cities
  • Radius: Maximum
  • Integrations: Snowflake, ADX
More pricing details

This plan is ideal for:
Revenue Management, Business Analysts, Product Managers, Operations, Developers

Premium

Unlock efficiency at scale with robust forecast modeling

custom

Contact us for pricing

  • Everything in Starter, plus
  • Event Categories: All
  • Future visibility: Maximum (years)
  • Historic visibility: Maximum (years)
  • Location type: Unlimited areas from cities, regions, countries
  • Integrations: All

This plan is ideal for:
Data Engineers, Data Scientists, Developers

See how your event data compares for free

Tracking events is complex, it's why we exist. Our core business is to collect, verify and enrich data and we don't expect our customers to have it all figured out.

We know that many customers have their own internal event database or collect data from a variety of sources. Send us your current event data set and we'll tell you what what you may be missing across different event categories, number of events and quality of data.

Simple. Accurate. Free.

Compare Data

You can’t prepare for what you don’t see coming

Harness the power of demand intelligence

Knowing the impact of demand causal factors like events will transform your business. The American Society of Hematology has a $45M estimated economic impact — and that's only one event in one city.

  • 0
    data points enriching
  • 0
    events across
  • 0
    cities, accessed via
    1 API

Get Started

Contact our data science experts to find out the best solutions for your business. We'll get back to you within 1 business day.

Talk to an Expert