Don’t be left in the dark
Harness the power of real-world events
Knowing the impact of incoming events will transform your business. RideLondon brings 280k people and $32 million to the city each year - and that's only one event.
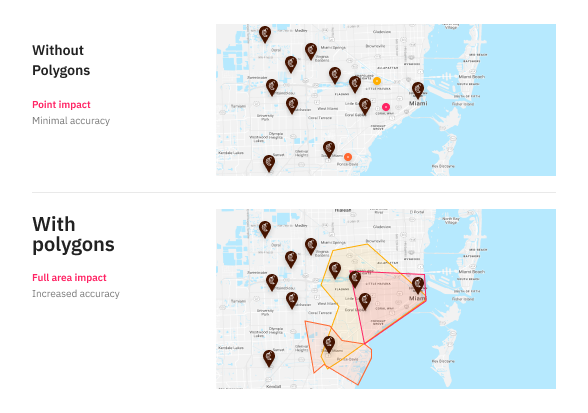
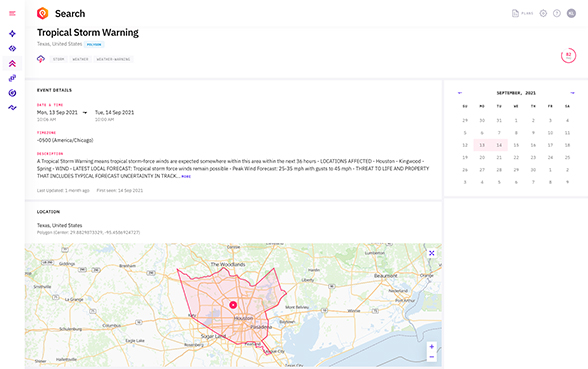
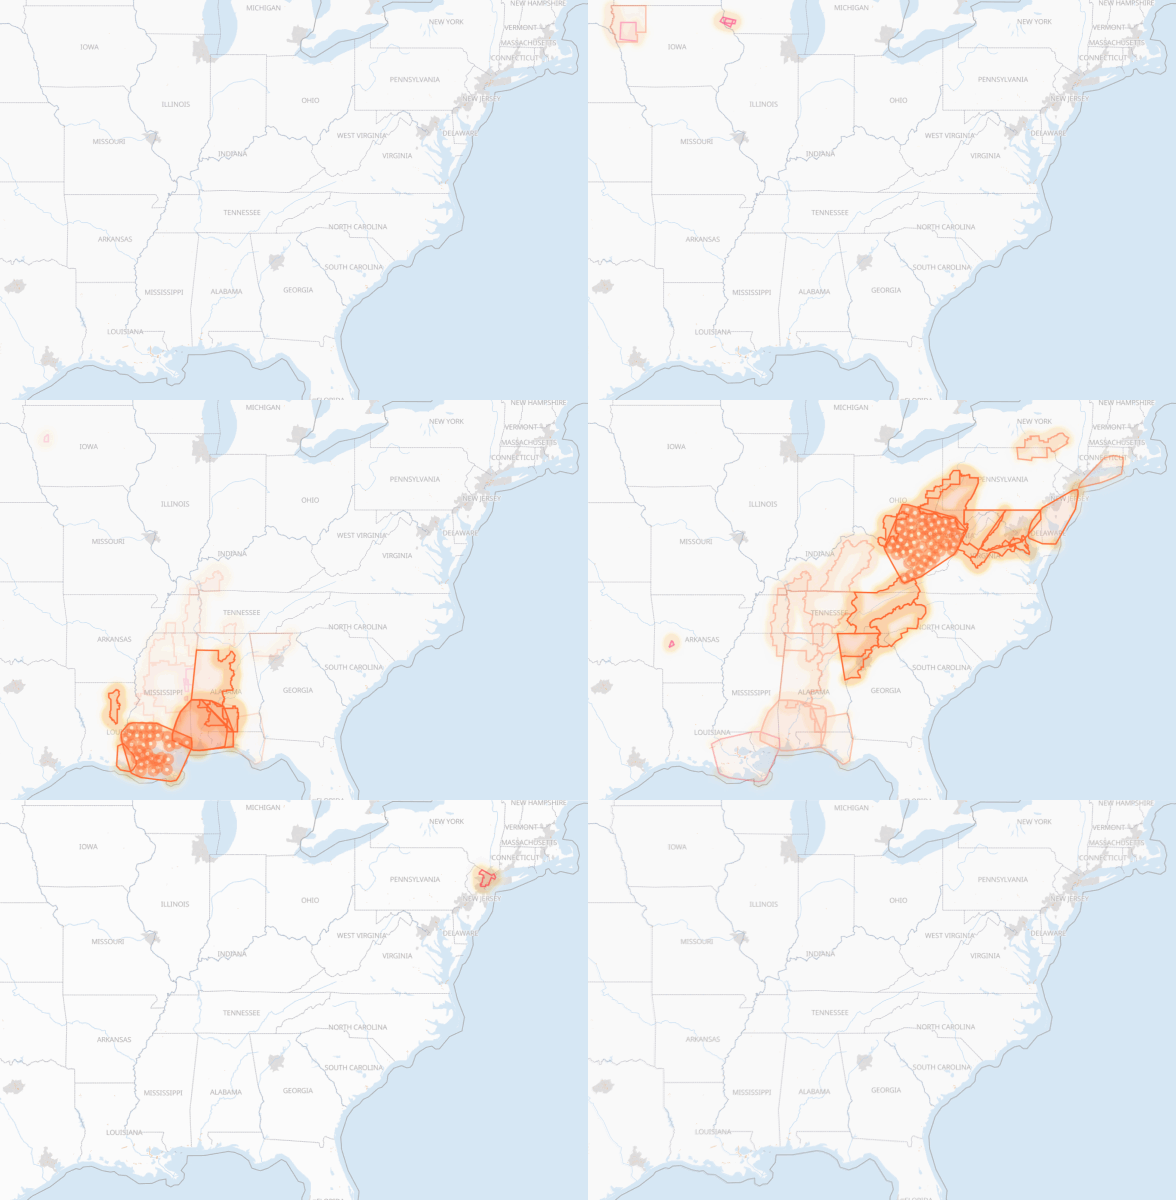
Accurately identify the geographic area impacted by events that do not happen at a specific location or venue. Events such as hurricanes, marathons, and parades cover more than just a point on a map and can now be tracked using Polygons.
Demand Forecasting: Incorporating events into models for smarter forecasting.
Labor optimization: Ensuring the right number of drivers and store staff to meet demand.
PredictHQ has supplemented incomplete data sets, including unticketed events and cancelled events, to power pricing strategies and operational decisions.
Demand forecasting: Incorporating events into their Antuit-built models to better understand demand across 9600 stores.
Amazon Alexa's "Events Near Me" feature uses PredictHQ data to inform users about local events.
Demand forecasting: Getting drivers in the right place ahead of time to improve pick-up times.
Event visibility: Available in Zartico’s platform enabling deeper insight and smarter decisions.
Pricing: A key source of intelligence for the OTA Insights platform, enabling smarter pricing.
Labor optimization: Enriching the Legion Technologies platform, used by retailers to reduce labor inefficiencies.


    "geo": {
  "geometry": {
    "coordinates": [
      [
        [ -92.55, 30.24 ],
        [ -92.539, 30.189 ],
        [ -92.6, 30.04 ],
        [ -92.75, 30.04 ],
        [ -92.66, 30.25 ],
        [ -92.55, 30.24 ]
      ]
    ],
    "type": "Polygon"
  }
},

Don't underestimate how much effort it takes to work with event data... Being able to rely on a company whose sole purpose is to remove the ambiguity of event data has been game-changing for us.
Knowing the impact of incoming events will transform your business. RideLondon brings 280k people and $32 million to the city each year - and that's only one event.
Contact our data science experts to find out the best solutions for your business. We'll get back to you within 1 business day.