Demand surges: A crystal ball into future event attendance


At PredictHQ, we track 19 event categories across 30,000 cities. To help our customers find the most impactful signals, we have built an extensive library of data science features for planning and forecasting use cases. Today I want to introduce you to a new one: the Demand Surge Alert. A Demand Surge Alert is when events in a city combine to have outsize impact, and these can be easily identified by our new Jupyter notebook you can easily run to find and explain these surges.
This feature has been particularly popular with data scientists who are focusing on explainability and taking their colleagues and managers who are less versed in a data scientist’s (sometimes) esoteric lexicon, and arming them with the toolset to do so themselves - be it their own customers, or senior stakeholders seeking an executive level report on demand level data.
What are demand surges?
A demand surge represents a significantly higher-than-usual spike in the amount of people attending events within a location. A location can be anything from the immediate area around a location of interest - such as a store or hotel - to larger geographies such as entire cities or states. The definition is flexible enough to allow a variety of use cases.
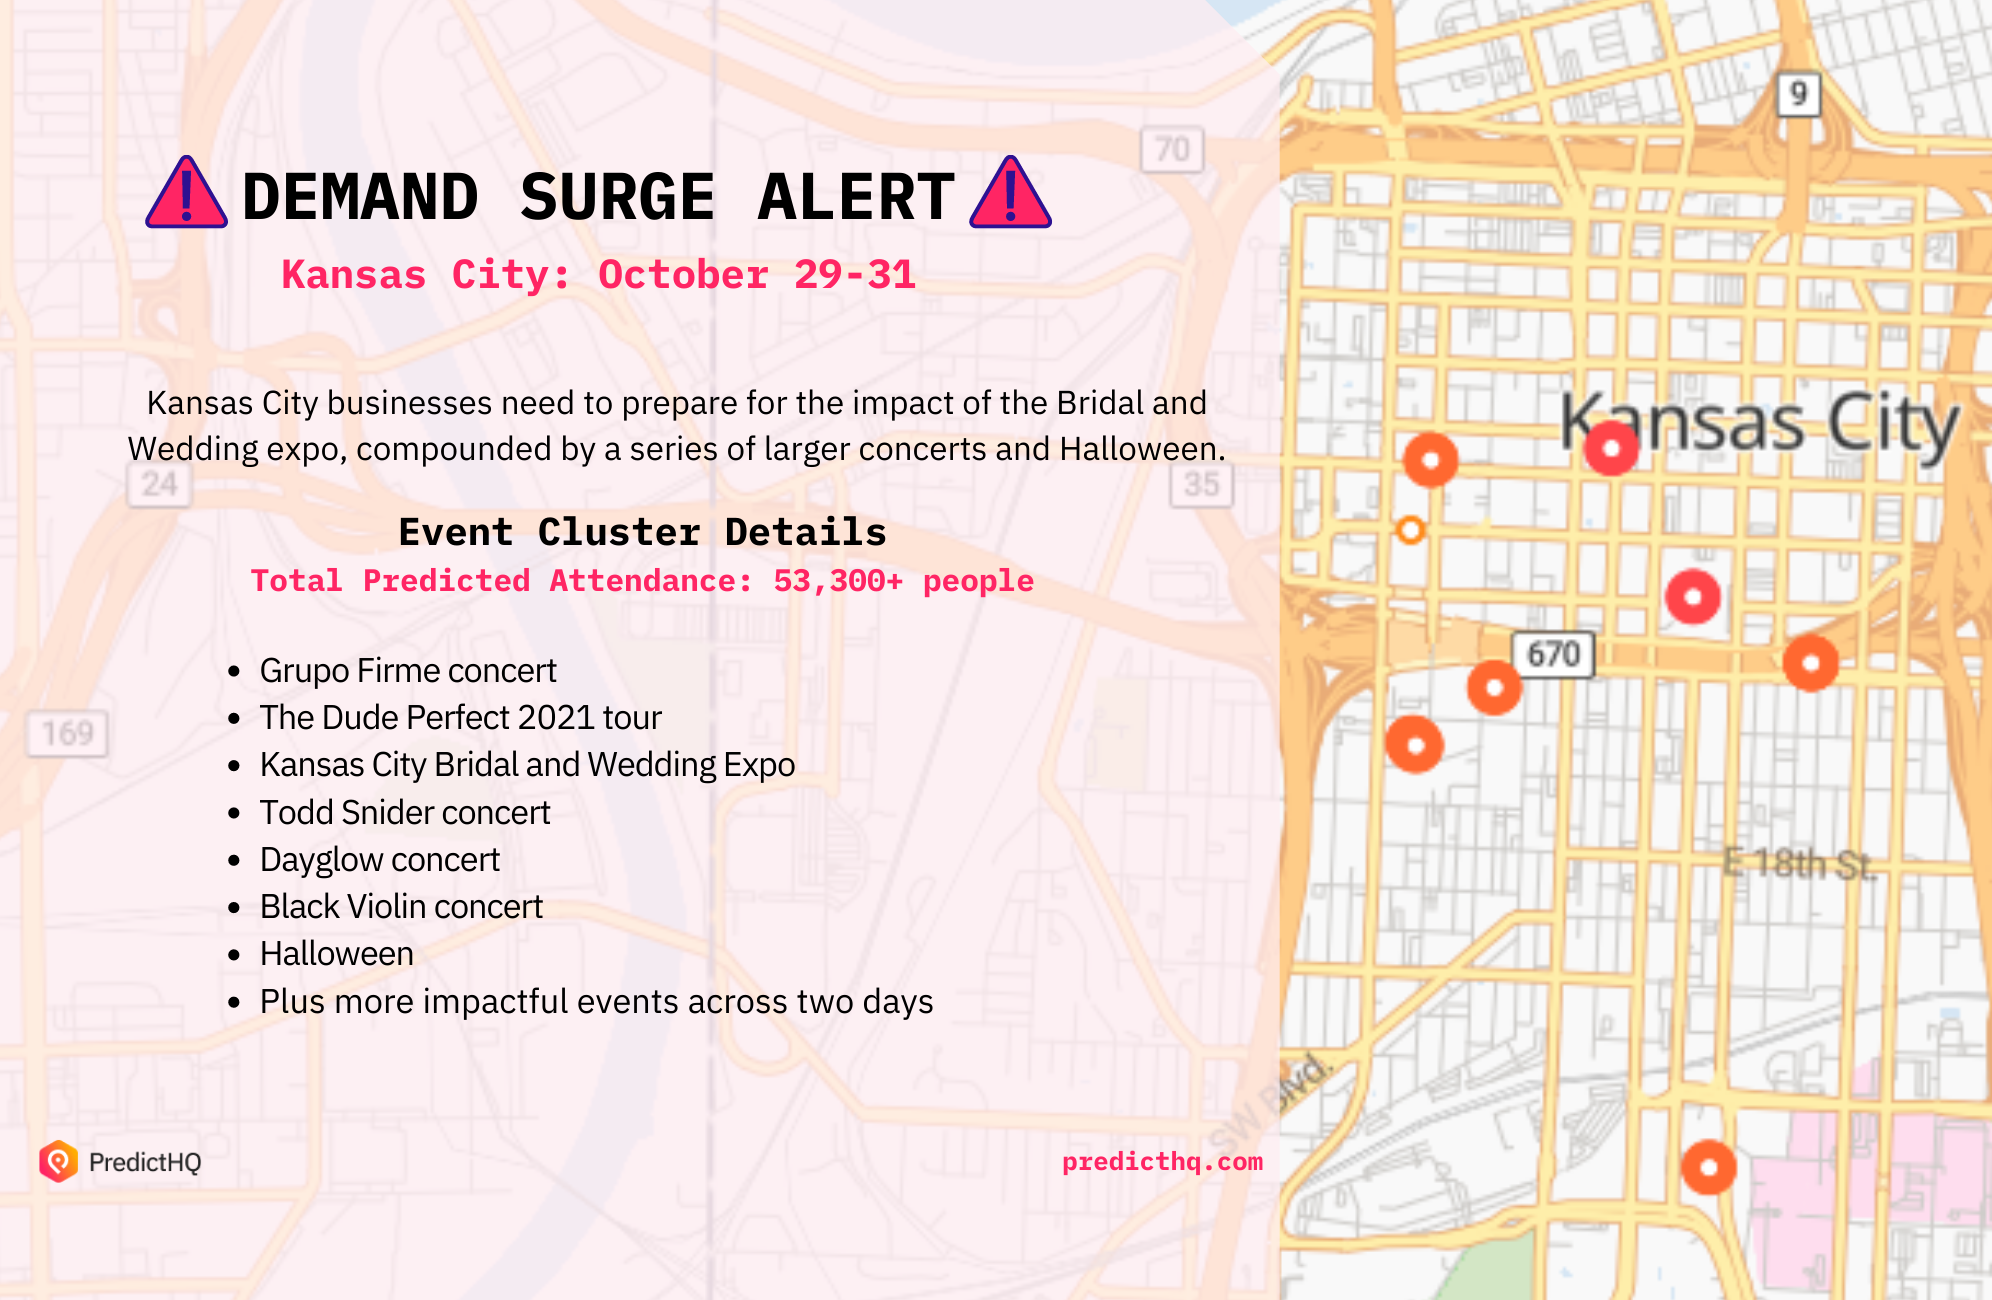
Where identified, demand surges may consist of a “perfect storm” of many events coinciding on the same day, week or weekend, or a handful of high impact events drawing in attendees from far away.
For example, looking at what’s happening around a location in central Boston looking at the period of August to October 2021 typically around 30,000 people attend events in a 10 mile radius around this location. We found demand surges on the 11th of October where 440,000 people were attending events in this location. This was due to the Boston marathon happening at the same time as a Red Sox game. Other events converging in the same day also contributed to the surge - such as the SoWa Open Market.
Since event attendance lies at the heart of a demand surge, our Features API can be used to predict total event attendance on any given day for a location. Finally, to aid interpretability and explainability, the raw event numbers are tied back to the names and descriptions of the actual events that contribute to the surge.
"Demand Surges can work as either the starting point or the destination of your demand intelligence journey"
We can vouch for this, because we have used demand surges successfully ourselves in our own media presence. Demand surges are a succinct way of drawing attention to the importance of demand forecasting for any organisation. They can work as either the starting point or the destination of your demand intelligence journey - either by providing a good starting point for further exploration and deep-diving into how events may impact your business, or by being able to ground an already observed impact into reality and thereby being able to make a more compelling case for the veracity of your forecasts.
In order to help you identify demand surges for your own business, we have published our own demand surge Jupyter notebook. Watch this video below on how to get started with demand surges:
The notebook shows you how you can use PredictHQ’s feature API and events API to show demand surges in your solution.
So grab your API key or register if you don’t already have one and start exploring demand surges. We’d love to hear your feedback, thoughts and ideas on how demand surges may be used for your business.


