Discover Your Catalysts of Demand: How Accommodation Companies use PredictHQ

There are so many factors to managing your occupancy rates and ensuring your properties are as profitable as they can be.
Maximizing yield without turning away too many potential customers. Adjusting your pricing and availability to perfect the ratio of direct bookings to retail bookings. Then there is staffing and inventory to manage, and of course the big one: constant competition.
Compression nights are rarer than ever as competition rises. Whether you’re running a hotel chain, a marketplace of privately-owned accommodation, a campervan or alternative accommodation company or provide a service to any of these, events are a major catalyst of demand that you need to start using to your advantage.
Because harnessing the power of events is so frustrating to do manually, PredictHQ’s API of millions of verified events is used by many accommodation companies, including Wyndham and Booking.com. We’ve also got many technology companies such as HQ Plus and Wheelhouse.
The impact of using events in your demand forecasting is significant. With PredictHQ, accommodation companies have achieved results such as:
Today I want to outline how accommodation companies use our demand intelligence as well as the tools we have created to ensure that your demand forecasting includes the impact of events to maximize the success of your business
Finding the events that matter for your properties
PredictHQ has more than 20 million events so finding what kind of events influence your demand is the first step. Once you know when your demand is going to spike, you can update your tools so your forecast and tools adjust your pricing and provide better data so you can maximize your yield strategies before your booking pace begins to skyrocket.
We cover 19 event categories, some of which are more powerful catalysts of demand for accommodation.
For example, our accommodation customers tend to find these categories to be major drivers of bookings:
Conferences
Expos
Sports
Concerts
Festivals
School holidays
For example, the American Society of Hematologists meets each year. This conference attracts more than 25,000 attendees, most of whom fly in for the event. It creates a demand spike for accommodation in its host city for five days and generates around $15 million in additional bookings. There are more than 20,000 conferences like it in terms of scale and impact per year.
Not all event categories create this kind of impact but it’s important to remember some of the less immediately relevant categories, such as community events, can form perfect storms of demand, which is when smaller events cluster to create big impact.
Once a team finds correlation with their demand and events, it opens up a whole new world of opportunities. Instead of scrambling to change packages, prices and staffing plans after a booking surge begins, you can confidently forecast and get ahead of your competitors.
Never miss a recurring event again
Advance knowledge of events is critical to unlocking the power of recurring events.
Ever had a big spike in bookings for a few days, filling much of your occupancy at a lower yield? It was almost certainly an event that caused this unforeseen demand increase.
Or prepared for a spike that occurred last year, only to have it not occur, or occur in another location you weren’t expecting or pricing for it? This is a demand pattern that recurring events can cause.
Around 15% of the millions of events we track recur, but 85% of recurring events change locations and dates each time. Many conferences, including the American Society of Hematology event mentioned above, change location every year.
When demand forecasting teams or city managers don’t know an event is recurring, it has two outcomes:
Properties in the previous year’s host city are overpriced, prepared for a demand spike that won’t re-materialize.
While the properties in a new city will sell out swiftly before you can adjust the relevant properties for greater yield.
Knowing which events are recurring at a glance enables you to scale individual yielding wins company-wide. It’s efficient and sustainable to be able to alert city managers to update their packages than hope say, a city manager of Boston will recognize a recurring event, google where it will take place next year and tell the city of manager of Atlanta to prepare.
To use recurring events:
PredictHQ tags recurring events with so you can see which events are part of a recurring group of events and details on how frequently they recur. This feature is still in beta, so you may need to request access to this feature.
If your company uses a demand forecasting model, our API can be directly integrated into your model so that you can account for the impact of recurring events in your demand forecast.
Find the closest events to properties with Radial Search
Whether you have multiple hotels in a city, and particularly if you run a marketplace of properties and generate a recommended rate to inform your vendors, you will need to be able to identify which properties will likely feel the biggest impact of each event.
That’s where our Radial Search feature comes in. We built it for accommodation companies to sort through our events to know which hotels or units will be most affected.

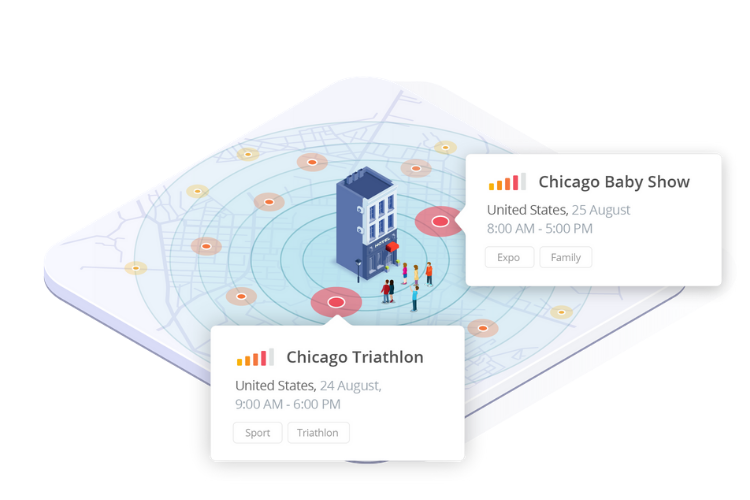
Imagine you manage six hotels across Chicago, or set the recommended rate for thousands of private property owners who rent out their spare rooms, units and houses. You are preparing for August, when there will be hundreds of significant impact events that you want to factor into your packaging and pricing.
For example:
The Chicago Baby Show attracts around 5,000 attendees, with about 2,000 flying into the city for it. The bookings will cluster around the event’s location at Navy Pier. So you would want to update your pricing and staffing schedules for locations near the event, rather than say on the West Side.
The Radial Search feature in PredictHQ enables you to search for events within a radius you choose. Whether that’s 2 miles, 5 miles or 50 miles, you can identify highly relevant events per property.
Once you know which events are closest to your hotels or marketplace offerings, you’ll be able to tailor your packages and pricing for higher yield, as well as ensure you have enough staff and supplies to meet demand without wastage. In many cases for hoteliers, re-allocating resources within your network both increases sales while minimizing waste.
TO USE RADIAL SEARCH:
Use the location_around parameter of the PredictHQ API.
Specify the latitude and longitude of the store or location you are searching for and how far an event should be away before the relevance decreases (e.g. every half a mile or 1 mile).
The API will add the proximity of the event to the user’s location as a relevance component. This means events that are further away will have a lower relevance.
Sorting on relevance allows you to find the highest impact events that are close to individual stores.
See the Spatial Relevance section in PredictHQ’s relevance guide for more details
Using PredictHQ’s ranking intelligence
Knowing the closest events to your properties is useful, but our systems aggregate and verify more than half a million events worldwide every month. With so many verified events to work with each month, our event impact ranking systems are key to success.
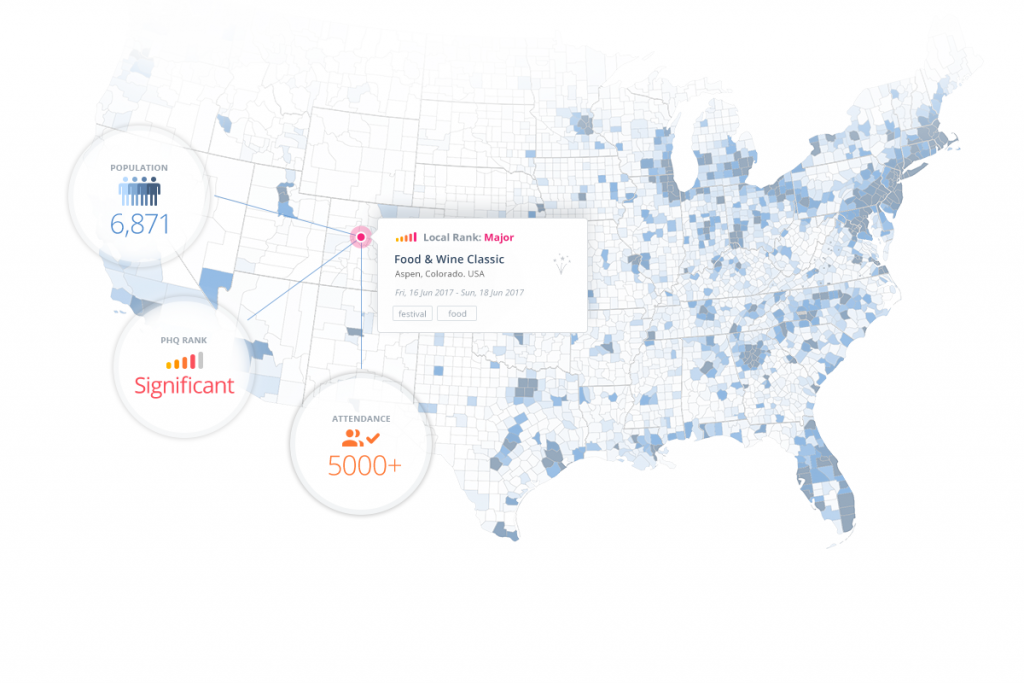
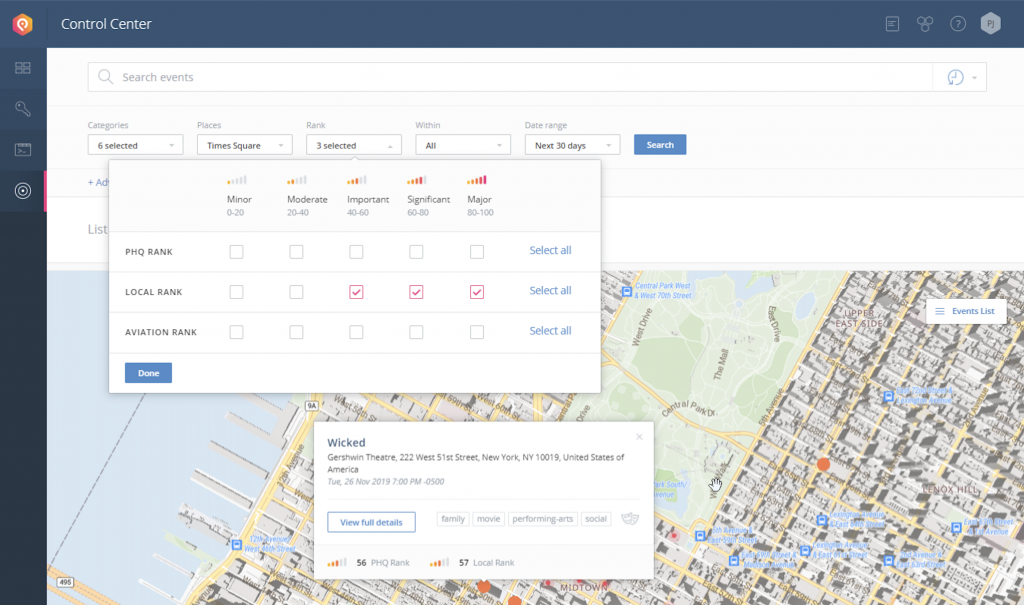
We have three ranking systems, which assign a log-scaled number between 0 to 100 that captures the impact on demand each event is expected to produce. These are calculated through a series of complex machine learning models.
PHQ Rank™ – indicates an event’s general predicted impact.
Local Rank™ – indicates an event’s predicted impact on its particular location, such as a city or town.
Aviation Rank™ – indicates an event’s predicted impact on flight bookings.
PHQ Rank is a quick way for accommodation providers to know which events are the most likely to have an impact. But the other two ranks are powerfully useful also.

Local Rank can reveal an impactful event for a hotel or set of properties that PHQ Rank score lower. This is because Local Rank draws on more factors to identify the impact of the event on its particular location. You can filter and sort on Local Rank to get those events which are most impactful to your location.
For example, an event that attracts 15,000 people in Munich won’t have a high Local Rank score, but in neighbouring Dachau with its population of ~150,000, it would be much more significant. Local Rank is a useful tool for all accommodation providers, and especially those identifying events outside of major cities, which tend to be smaller.
More valuable for major hoteliers and accommodation providers targeting the bigger cities is Aviation Rank. Aviation Rank identifies an event’s impact on flight bookings, so can be used to indicate the level of inbound passengers who will need accommodation. Particularly for airport or CBD properties, this can be a gold mine of information.
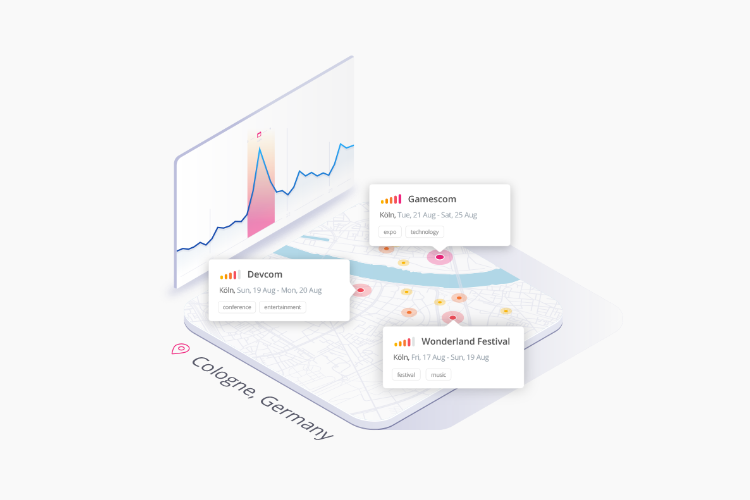
For example, Gamescom is an annual event in Cologne, Germany for 4 days. It attracts 370,500 people, and Aviation Rank identifies that 57% of attendees fly in for this event. That’s more than 200,000 people will need accommodation. Every accommodation provider in Cologne knows this, as Gamescom is a recurring event in that city.
But it’s only one of 10,000+ expos each year in Europe alone, many of which change location each time. Aviation Rank is a powerful indicator of incoming customers, although it is important to keep in mind it doesn’t cover other transport into a city, such as cars, trains and buses.
Uncovering Perfect Storms of Demand
While the ranks are useful, accommodation companies that only optimize for the highest ranked events would be missing out.
Perfect storms of demand are when small to medium sized events cluster to create major impact. It’s easy to know when the big events are coming, but the real competitive advantage comes from knowing when perfect storms of demand with similar or even greater impact are coming.

Identifying perfect storms of demand is impossible without PredictHQ’s ranked events. They can be identified at the city or airport level, as well as around a particular geolocation. Using Local Rank and Radial Search, companies are able to spot these storms before they’re caught in the middle of them unprepared. Knowing they’re coming means you can set prices, packages and update staffing schedules, while your competitors are flailing.
(We have some exciting news about perfect storm identification coming shortly that we can’t wait to share with you.)
Adding event visibility into your workflow
PredictHQ customers have visibility into which categories and cities they can currently access via our Control Center. From here, customers can also add other categories, change their event visibility and add other cities.

We are also currently offering a limited beta to some of our customers to a new category – Academic Events. At this stage, the beta only includes US tertiary education dates. Academic Events have huge impact on companies with stores near university and college campuses where the difference between study weeks and holidays can remove thousands of customers.
All of the features mentioned above requires huge quantities of verified and ranked event data. Sourcing enough data may seem manageable for teams at first — before they try to use the data in their models, and realize that aggregation is only the first step towards the demand intelligence they need.


