How to visualize impactful events near you


Paint a clear picture for clear strategic choices
Proactively communicating upcoming demand-driving events creates trust and alignment across teams for great results. Today, I want to walk you through three ways our customers select the most relevant events for their locations and how they visualize these events using our platform for their teams. This enables their teams– whether they're hotel managers, store managers or area managers– to make the most informed and profitable decisions when it comes to pricing, staffing and inventory management.
How intelligent event data visuals drive informed demand planning
Demand intelligence enables companies in all kinds of industries to use reliable, enriched event data to help them plan around upcoming events with accuracy. Operations managers and their teams can now log in, use Search to find events relevant to their business locations, and investigate details that give them actionable foresight. Whether you’re producing reports in your headquarters for a national or international network of hotel and property managers, or you are a revenue manager working to assist with labor optimization in a specific city or state with a subset of stores, you need to make sure the team members who will act on this information are informed and empowered.
For example, let’s say you’re a revenue manager for a hotel in Miami, Florida. In December 2021, there are a number of holidays, expos, community events, live and televised sports games, and school closings that impact travel and the amount of people looking for a hotel room on those days.
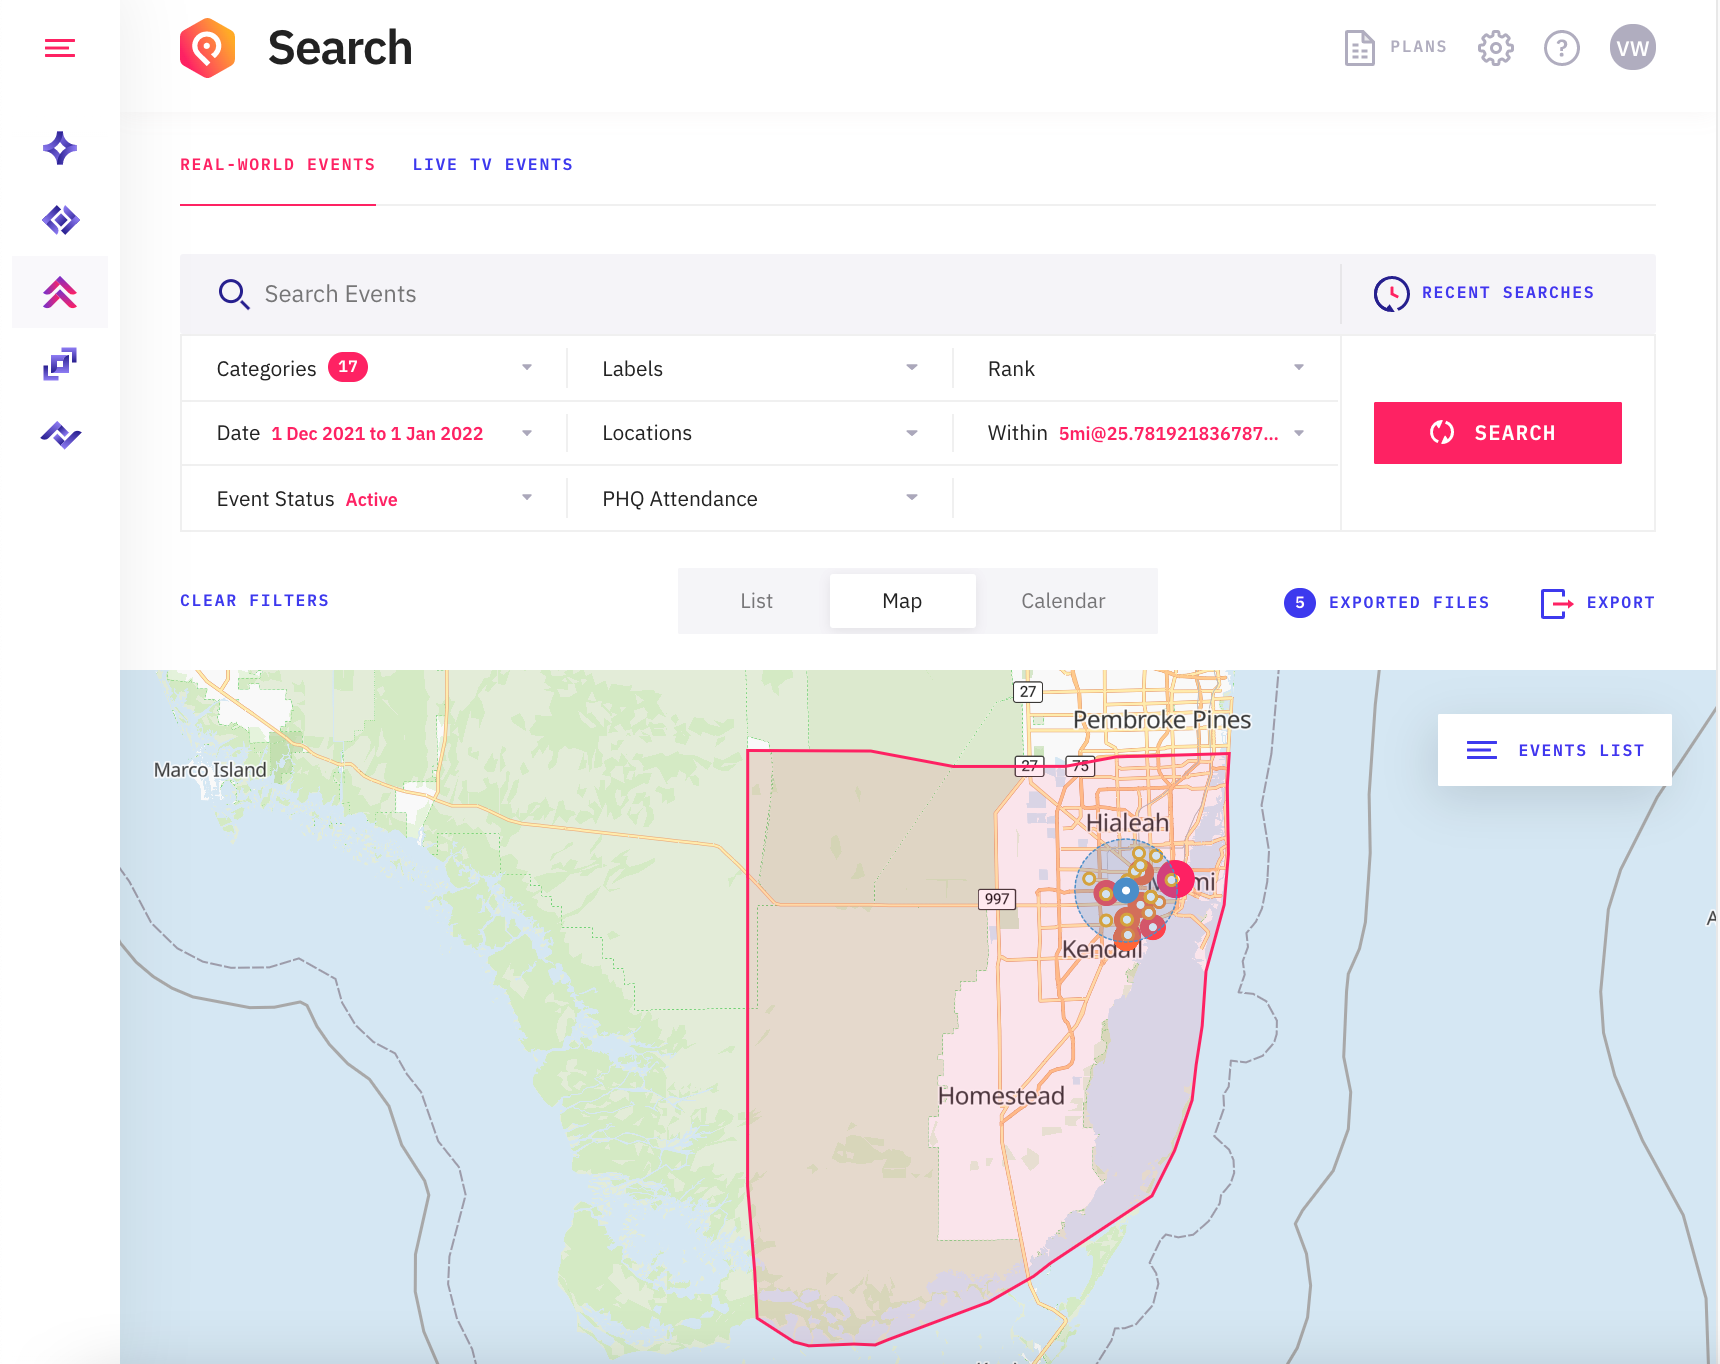
In our Control Center, you can easily find events taking place within a given radius of your hotel, and the context around those events. In this example, let’s take a look at events happening between December 1, 2021 and January 1, 2022 within 5 miles of the Hilton Miami Airport Blue Lagoon hotel in Miami, Florida. By using the GPS coordinates of the building, they can see– and plan for what’s coming ahead.
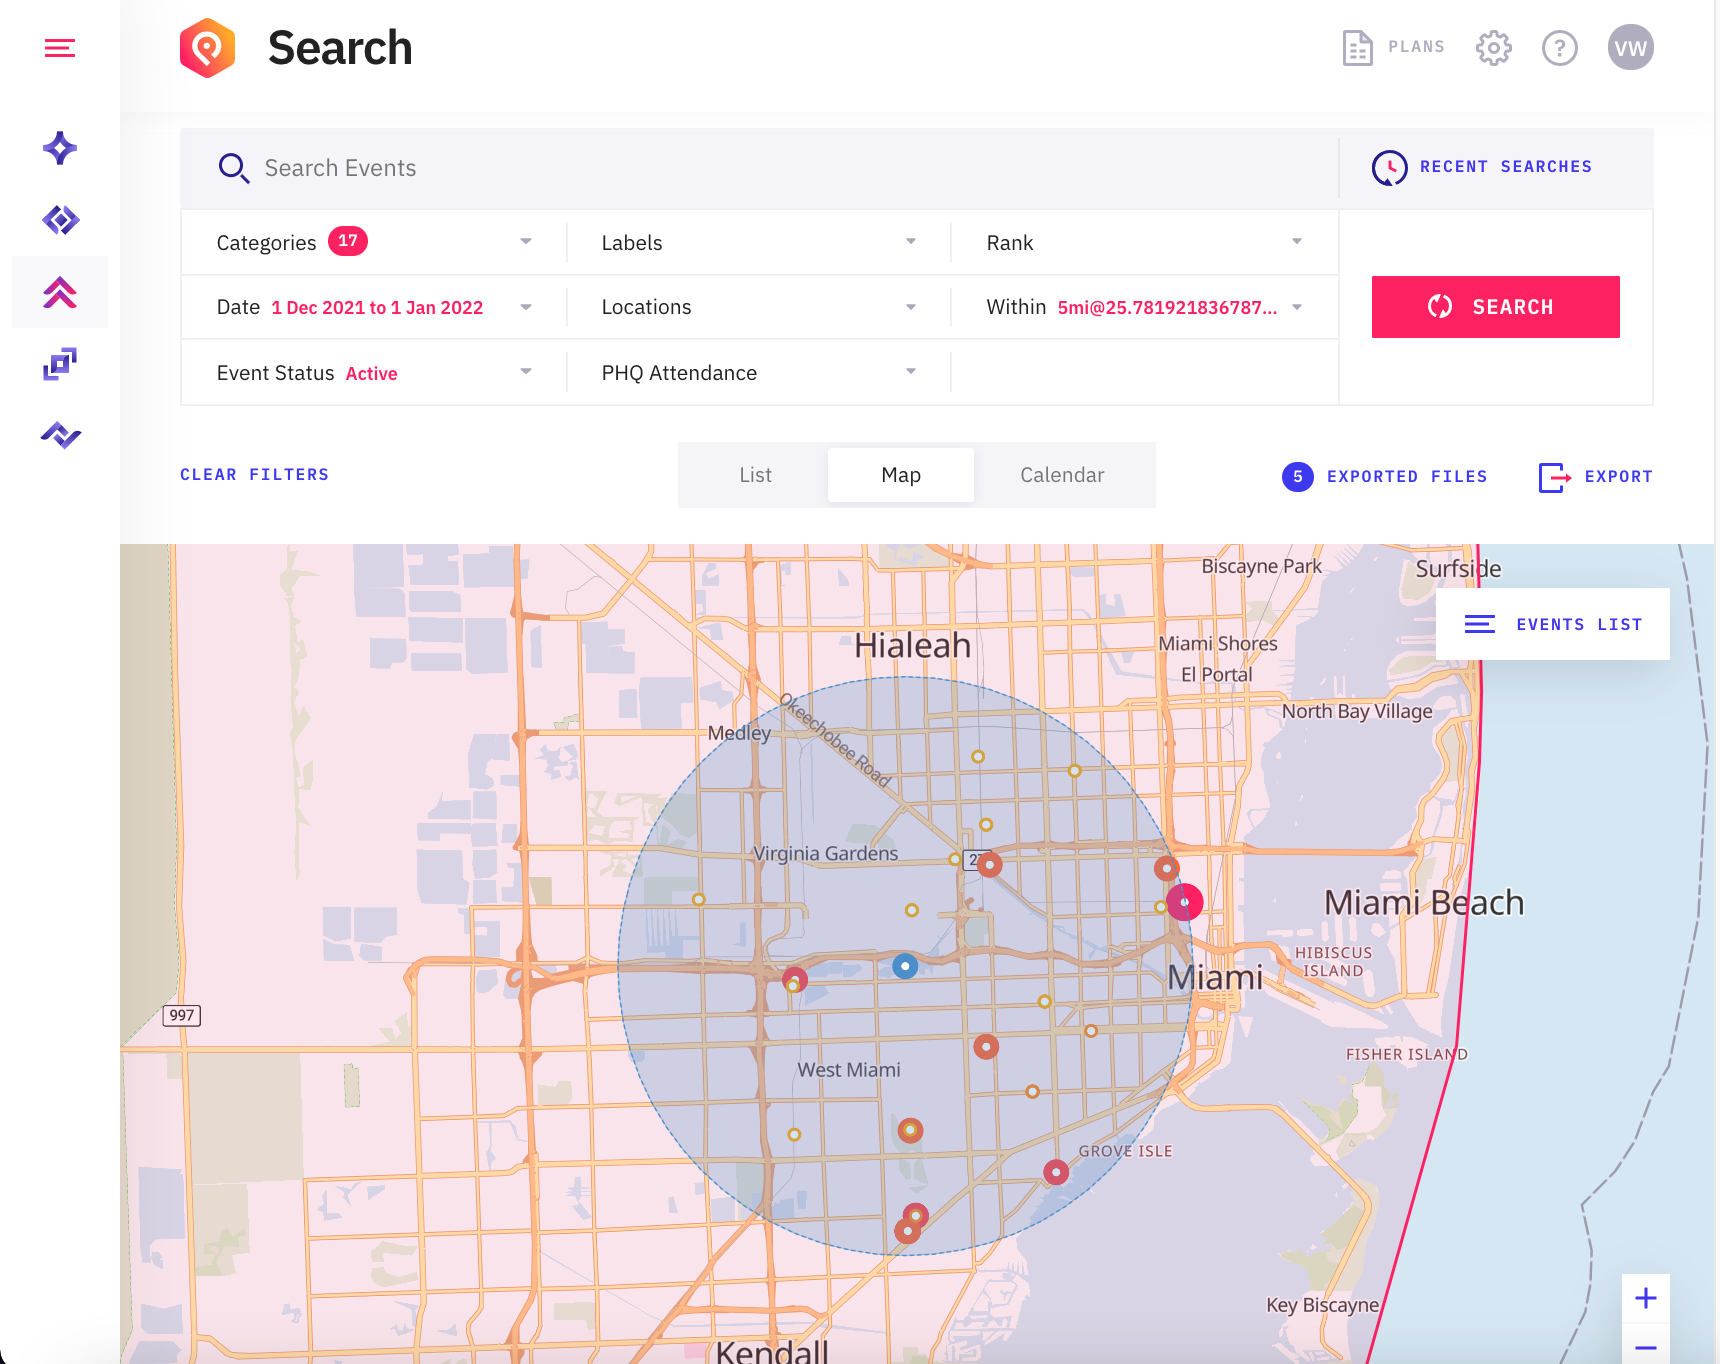
The small blue dot at the center is the hotel. The large blue circle represents the selected radius. The pink shape containing most of the map above represents the Miami-Dade County Public School District, which will be on Christmas Break from December 18, 2021 through January 2, 2022. Each of the orange and pink dots on the map represents an event, which you can see by clicking on the Events List button in the top right corner of the map:
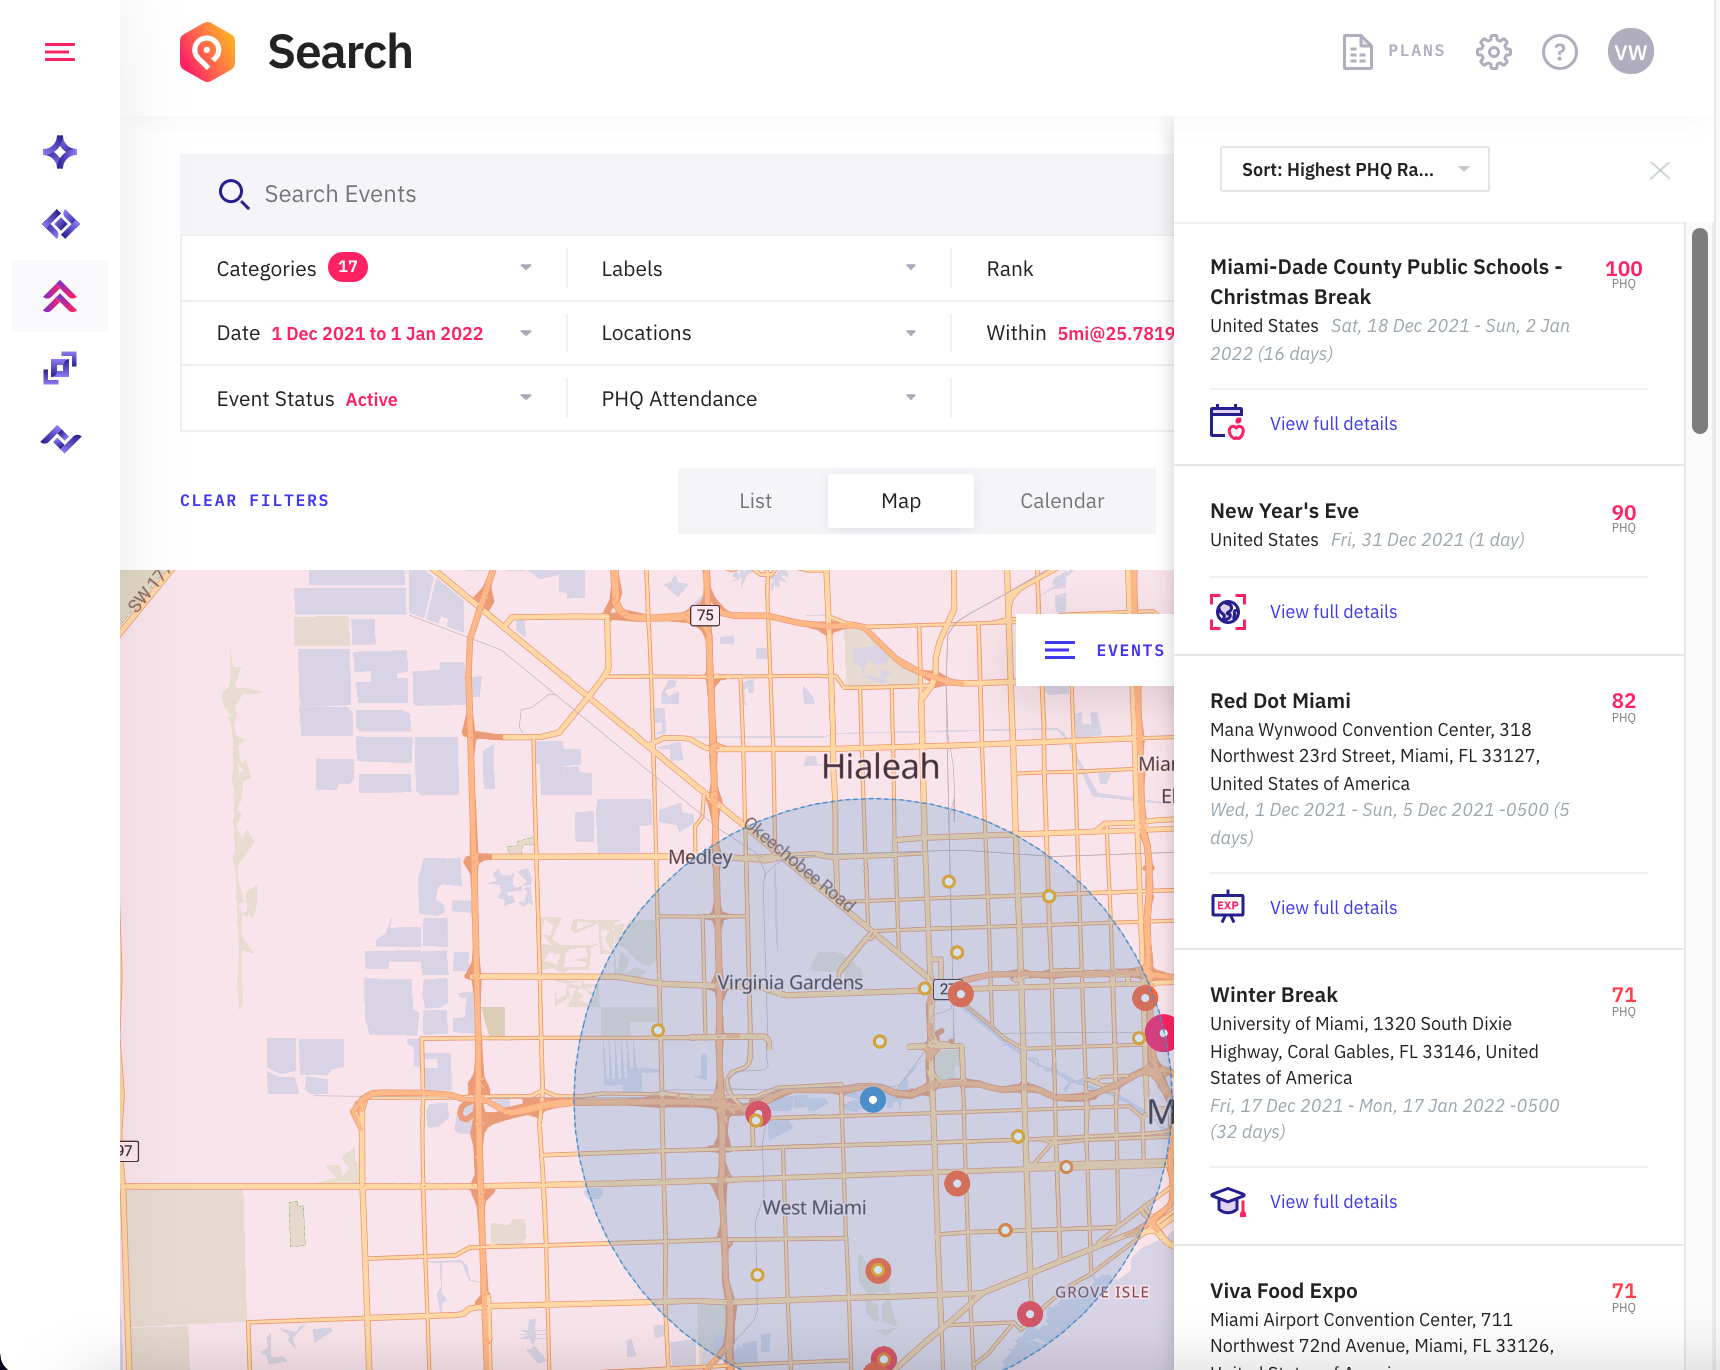
Reviewing search results in different views makes it easy to gain a comprehensive understanding of impactful events that will drive demand, and helps add context to conversations around strategic operational decisions. With a visual like the screenshot above, it’s that much easier to explain why decisions need to be made at certain times with proof from verified data. Visuals also help to explain the story behind spikes in demand that would otherwise be tedious and nearly impossible for managers to quickly gather, understand, and communicate to key stakeholders.
Different views to suit your needs
With options for how you view search results, operations managers are able to leverage colorful, engaging visuals to present a clear picture of incoming demand to their teams. Here are three easy ways to visualize event data in our control center to help inform stakeholders and teams who need to take action from this information:
1. Calendar View: See the month at a glance
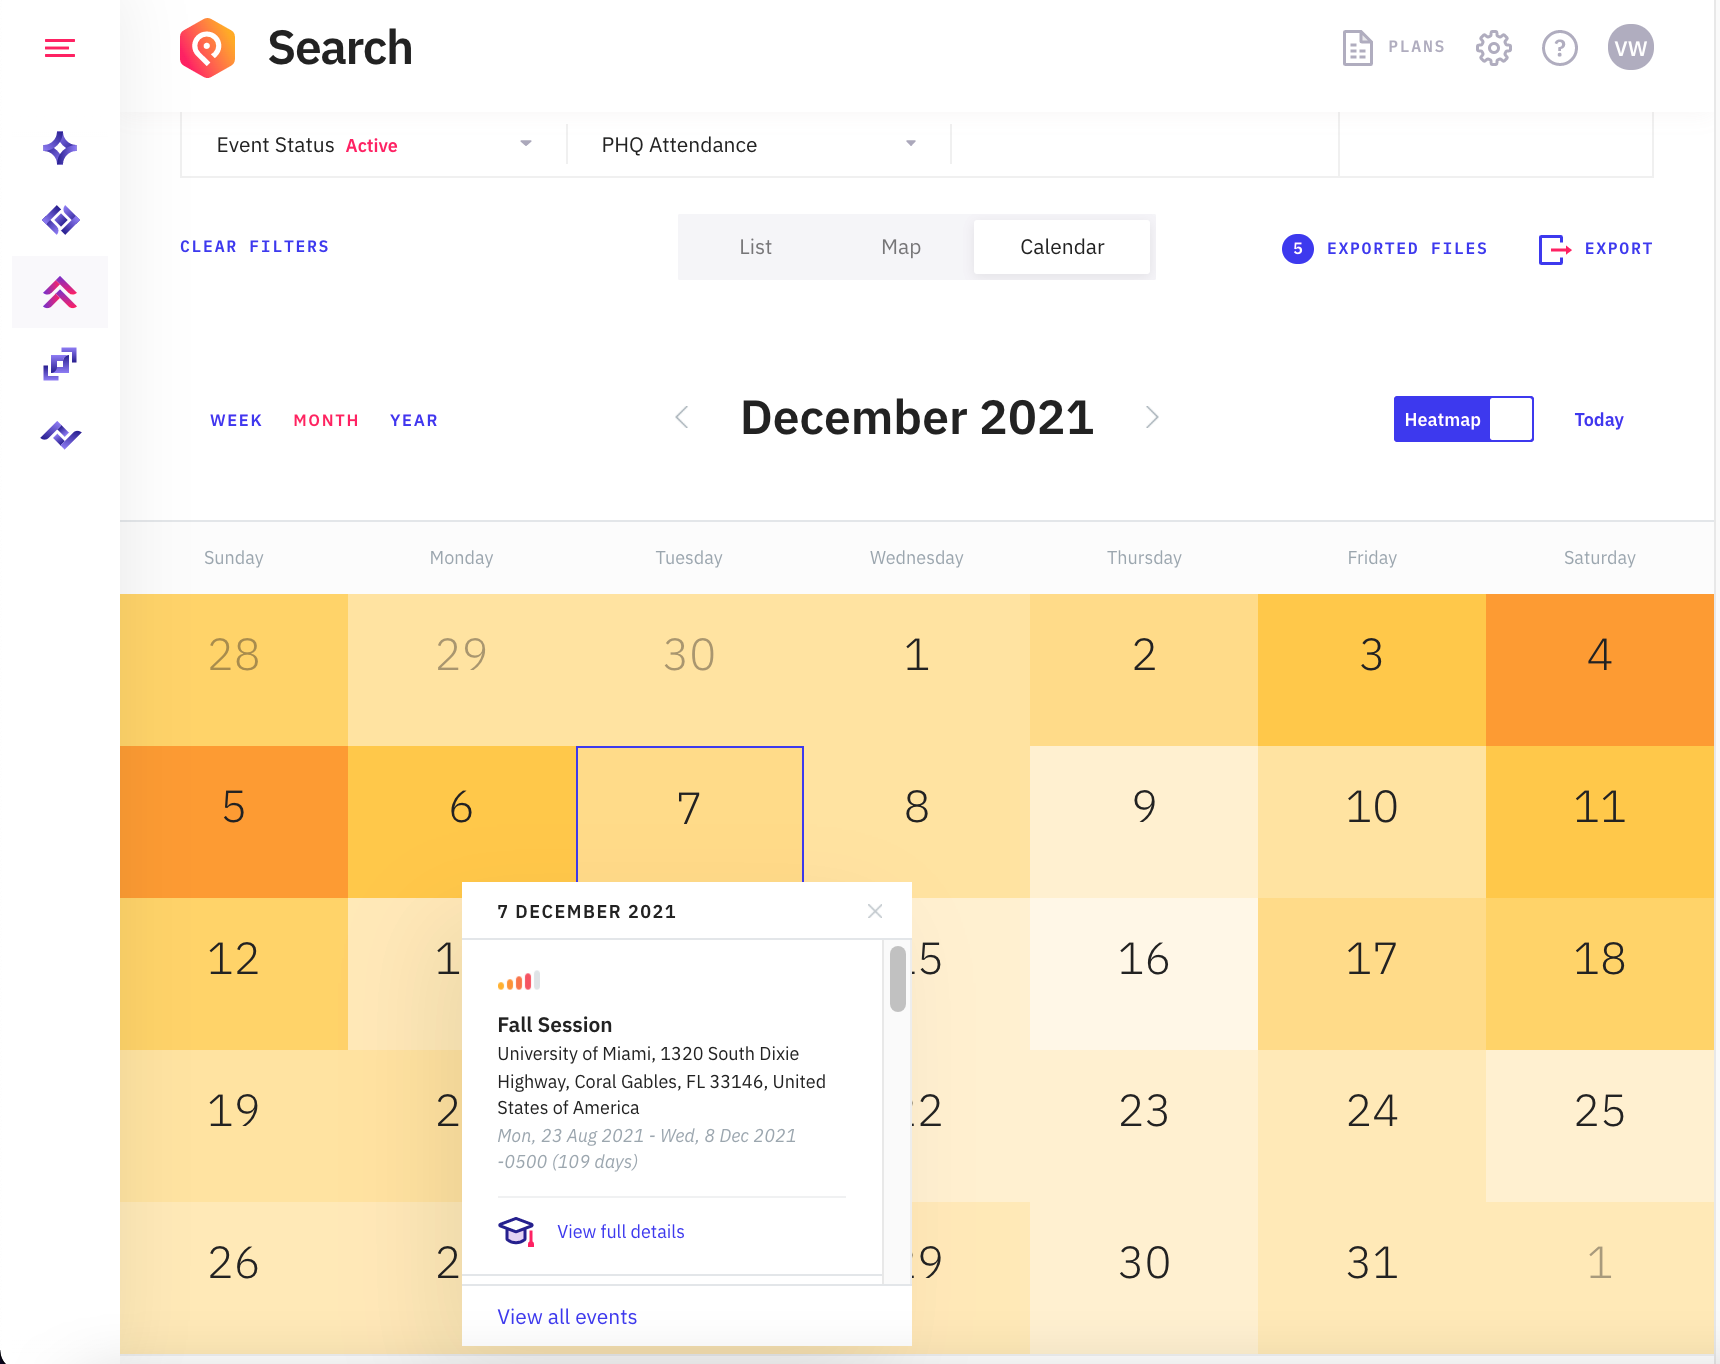
Get the rest of your team excited and ready for the month ahead with the Calendar View. Click on any of the days for a quick look at the events taking place, and click on any of those events for more details.
Toggle the heatmap option to see which days have the most events taking place indicated by color. It’s a great tool for a quick scan of which days to look further into, and easily spot potential demand surges at a glance. Look ahead into months that are usually busy for you, and see what to expect in terms of which days have the most and largest events. You may come across unexpected demand surges that mean an opportunity to prepare ahead of time.
With this level of foresight, you have the justification you need to explain why you need to adjust your prices, inventory, or staffing for a particularly slow or demanding period. Plan for success with accurate predictions your team can rely on time and time again.
Calendar view gives you a quick overview of events for any given day. If you want more detail, click “View all events” to see the full list of events for that day complete with event details.
2. Full List of Events
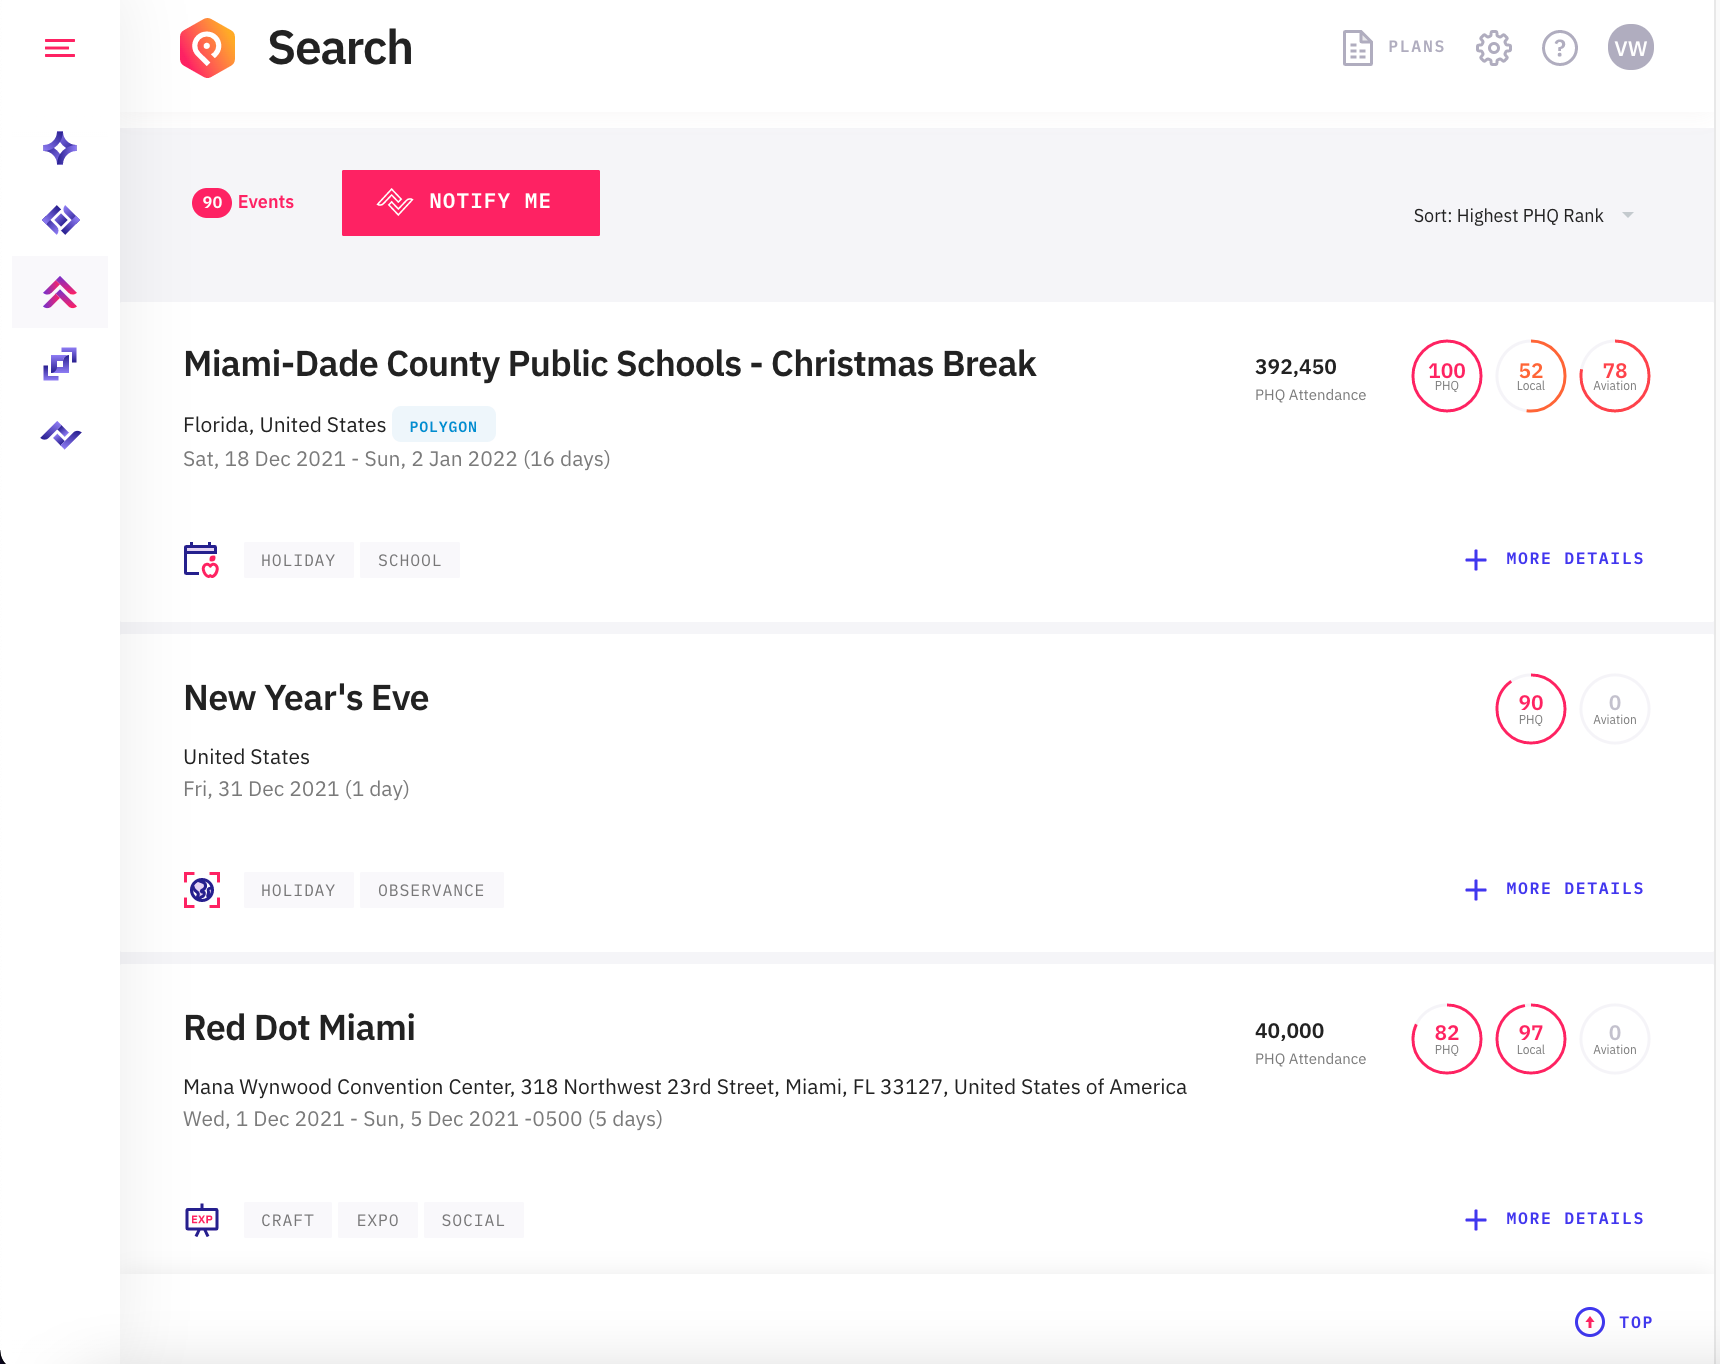
The List View is the default view you’ll see search results in. Share this view to give your team a full rundown of upcoming events including each event’s:
Title
Date
Location
Venue
Start and end time
Predicted attendance
If this is a search you’ll want to track for updates, click on Notify Me to be notified each time an event within your criteria is added to the data set – or as an hourly, daily, or weekly digest. Notifications keep you and members of your team up to date with new events that will drive impact, and changes to existing events you're tracking.
3. Detailed Map View
In the Map View, you can drill down to a specific country, region, address, and even use GPS coordinates to see upcoming events within a selected radius. Always stay two steps ahead by sharing a useful visual of what’s to come for a selected timeframe near locations that matter to you.
This view makes it easy to see how busy an area will be with a glance including scheduled events and unscheduled ones such as severe weather that can have a major influence on demand forecasts. For teams that cover multiple regions, states, or countries, a map indicating how many impactful events are happening can help to spot patterns and explain why demand is greater in certain locations than others. It can also help to uncover opportunities for community outreach, cross-promotion, and collaboration when there's a cluster of events bringing in a rush of potential customers for a day, or a weekend.
As businesses find their footing after months of recovery in a rapidly changing competitive landscape, it’s never been more important to know which events are driving demand. Don’t miss out on a crucial opportunity to get ahead of your competitors with reliable event data and actionable foresight to position your business for success.


