Introducing our Control Center web application: Your central hub to track event impact


You asked. We delivered.
Our goal is to provide scalable demand intelligence so you don’t have to feel you are in over your head on how to create the time to pull together high quality data yourself, nor will you and your team need to spend valuable time going through it.
As we’ve refined our API over the last couple of years, we’ve discovered that the power of event visibility is much greater than we ever imagined. We’ve learned from our customers – such as airlines, hotels, food retailers, and ride sharing companies – just how impactful intelligent event data can be to inform data models, dynamic pricing, demand forecasting, and much more.
As we continue to evolve alongside our amazing customers, we see more and more opportunity to improve our API. One of those areas is how PredictHQ users interact with our data. We found that there was a need to enable our customers with a holistic view of their PredictHQ data and activity – which is why we’ve designed Control Center.
Hello Control Center
A world class API needs a world class toolset, starting with an easy-to-use web application. Control Center brings you an amazing suite of tools for exploring, searching, managing and utilizing demand intelligence data to make your business succeed. Every API subscriber will have access to Control Center with all the tools needed in one place. It enables:
Smoother collaboration between product managers, data scientists and developers using PredictHQ’s demand intelligence in their forecasting.
A new lightning fast way of searching for and discovering events.
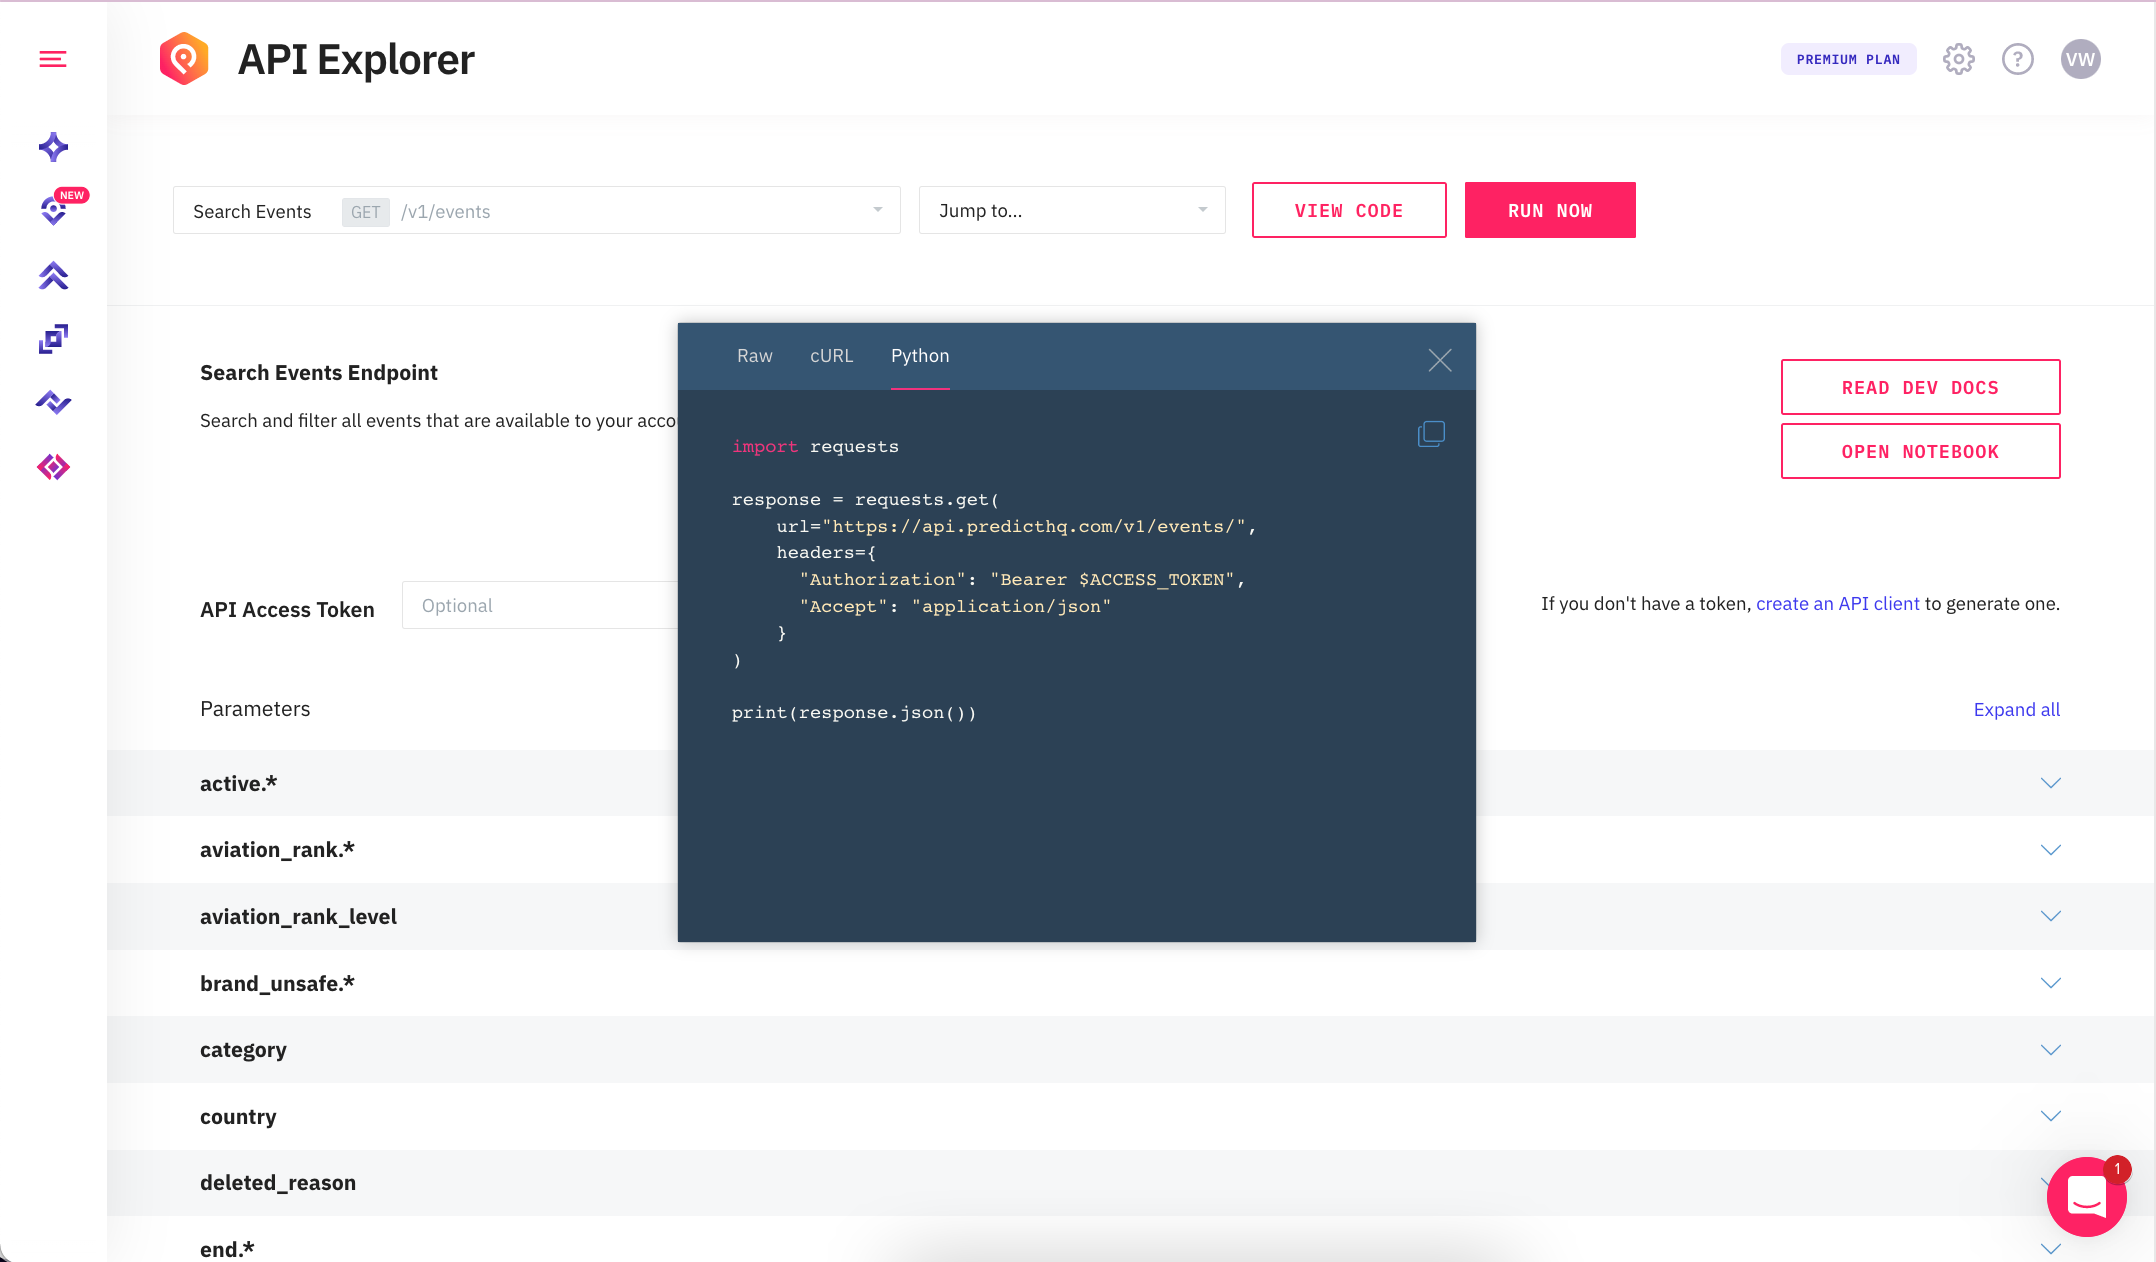
Explore the capabilities of the API and generate code to get the quality data you need.
A summary of your PredictHQ subscription so you know the extent of your event visibility, coverage across cities and categories.
Think of it as your central hub. Discover and manage your API and all of the intelligent event data your business needs through one single place. Plus, quickly search and discover events via a list, calendar or map view. Control Center is the next step in harnessing the power of event data.
Here are three of the most exciting features in the web application:
1. It makes event data more accessible to your team
Not every PredictHQ user is a data scientist or developer. There are many functions within organizations that benefit from event data and the insights that come with it. And we’re excited to share it’s now even easier for you to access it.
Users such as product managers can easily search for events without needing to call an API—enabling them to quickly evaluate the data and to see value faster.
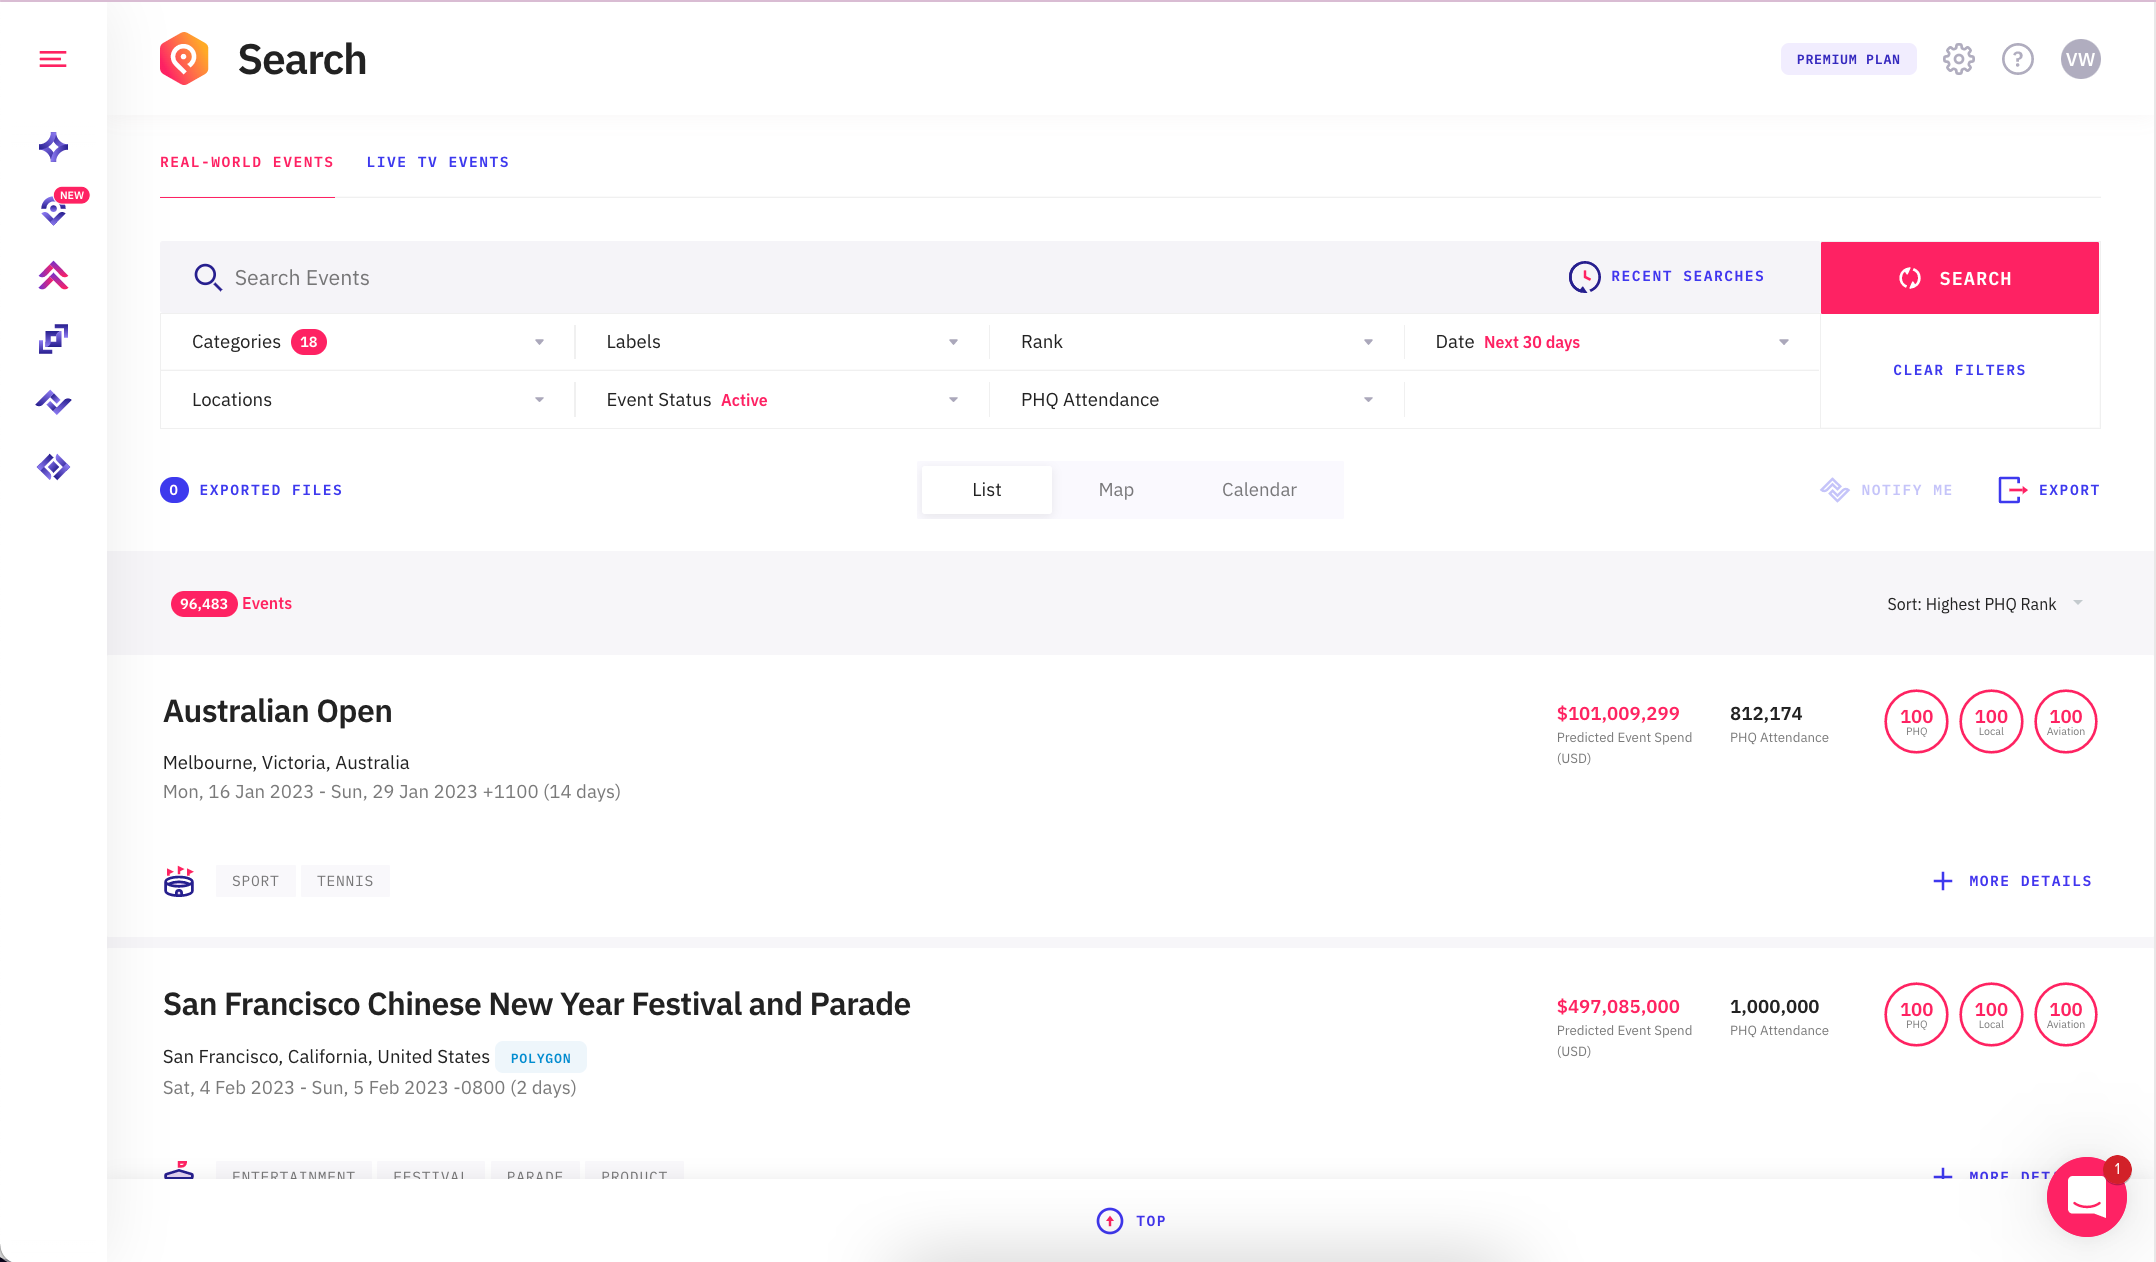
Imagine you are a revenue manager at a major airline company and you need to quickly gather an answer on what the top events are in the month of September that will likely impact your business. With Control Center, you can do a quick search for events within that month immediately and deliver a quick response to your exec team.
2. It increases visibility through one central place
We cover 19 categories of events across 30,000 cities, so knowing which you have access to can be hard to keep track of. Control Center completely eliminates the guesswork. Access a clean and intuitive dashboard that allows you to easily view what is included in your plan and what other PredictHQ data you could have access to.
We wanted to build a tool that provides insight into what searches are being performed, what results are being returned for those searches, and what the account restrictions are. Increased visibility will enable customers to more quickly identify issues.
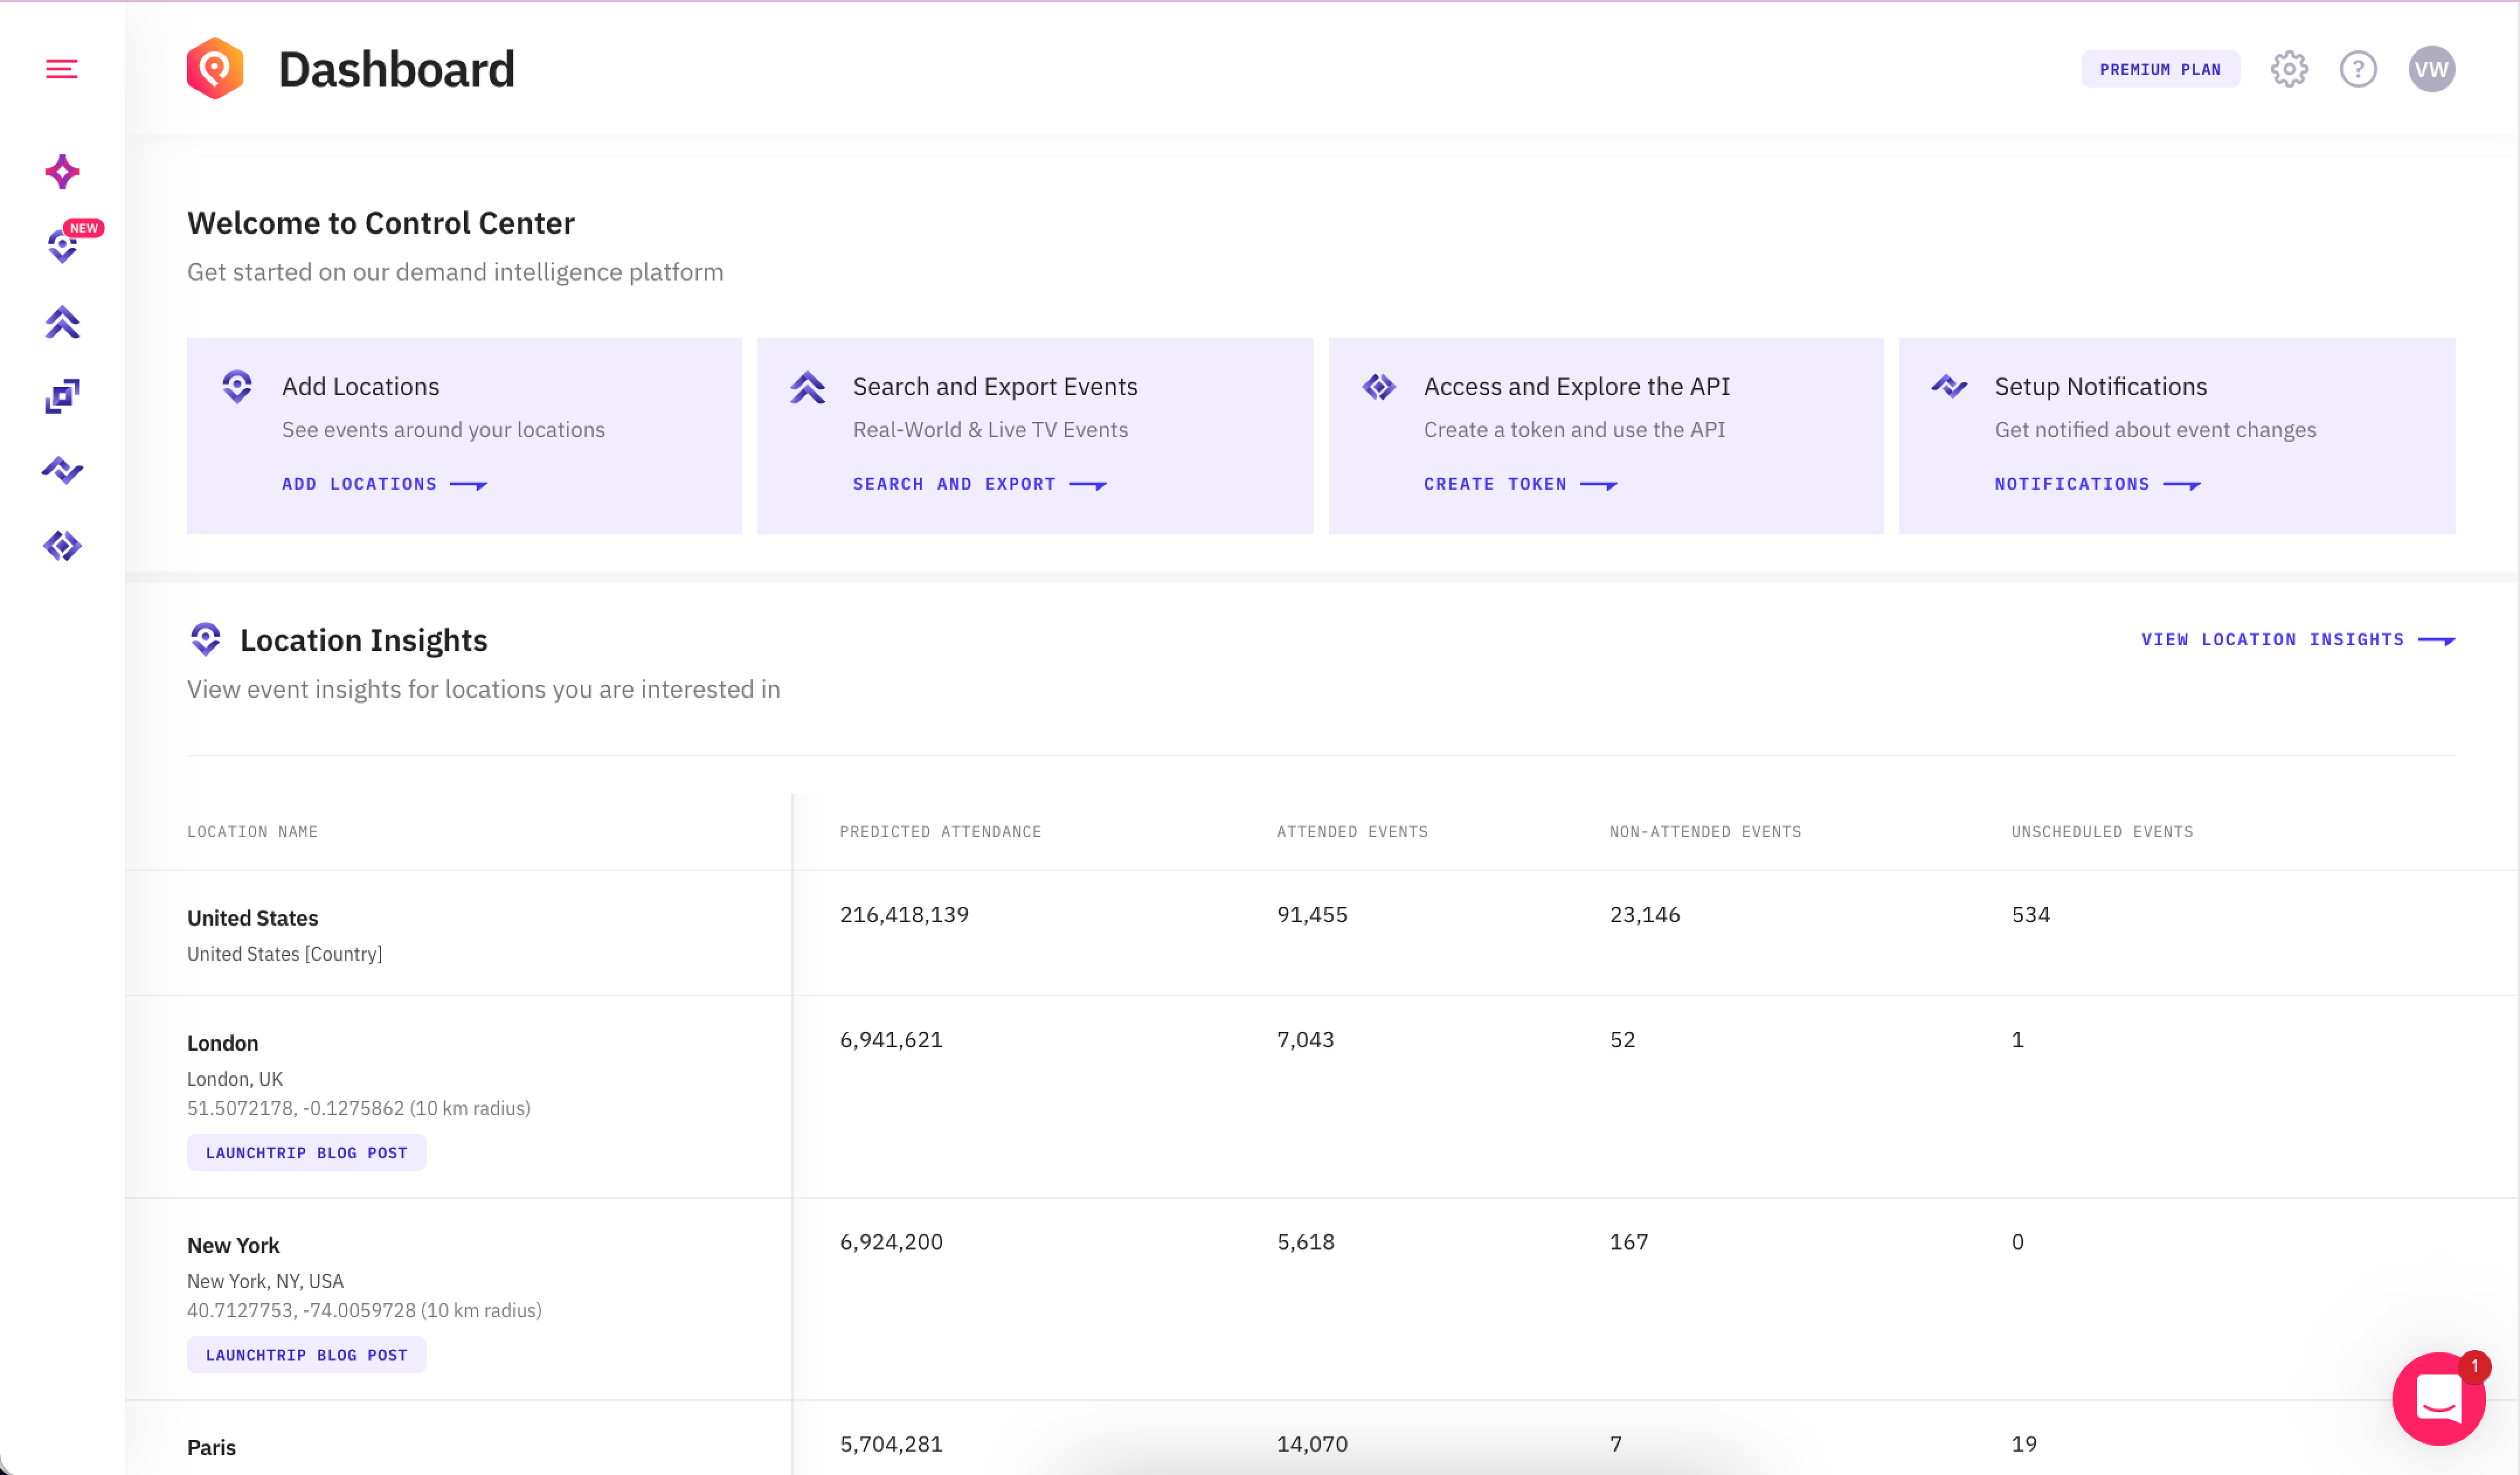
For example, let's say you want to search for all events in the city of Chicago. You make an API call and nothing is returned for Chicago. With Control Center, you can quickly look at a map of the locations you have access to with your account, and see that Chicago isn’t there. You can either request that the city is added to your subscription right then and there, or focus on a different city that you do have access to. As you continue unlocking new use cases with demand intelligence data, you can choose to expand your subscription to more cities as you see fit.
3. Easily explore the capabilities of the API
Data scientists and developers told us they were previously frustrated by the lack of testing functionality within the API. It creates unnecessary barriers like running into parameter errors and wading through documentation to understand capabilities. We heard you.
In the Control Center web application, you can explore all of the capabilities and features with the API Explorer. You’ll be able to get familiar with the API quickly, which will enable you to start leveraging the data faster. Plus, the explorer generates clean code to use, which will reduce errors caused by using the wrong parameters or using parameters incorrectly.
Log in to access Control Center today
We can’t wait for you to get your hands on the major upgrades. Control Center will help you do your job more efficiently and help you get smarter results.
If you’re an existing customer, log into your account to check it out. And if you’re curious to learn more, feel free to reach out to our team here. We’re excited to share Control Center and can’t wait to hear what you think.


