Discover the true impact of severe weather events on retail demand so your models and teams can make the best decisions at scale: PredictHQ Demand Impact Patterns


Over the last year, our data science team has been trawling through mountains of demand data and severe weather data and constructing models to accurately represent how 73 severe weather event types impact retailers' demand. It’s taken billions of data points and some truly innovative data science, but we can now equip our customers with a statistically sound indication of how many days on either side of a severe weather event will be impacted as well as the severity of this impact.
A lot of work went into PredictHQ Demand Impact Patterns, so we have a lot to unpack in this post. But in a nutshell: Demand Impact Patterns is the generalized impact pattern of 73 kinds of severe weather events to inform machine learning models about the true extent of an event. We created it so companies can update their forecasts and plans as soon as reliable information is available, saving millions in preventable wastage, out-of-stocks or staffing issues. With this demand intelligence, retailers can:
Ensure appropriate safety plans are in place for stores likely to be impacted
Update forecasts and plans to match what’s happening on the ground
Redirect inventory likely to go to waste to stores that won’t be impacted
Ensure adequate volumes of items that are likely to sell out
Match staffing plans to the predicted impact
How Demand Impact Patterns work
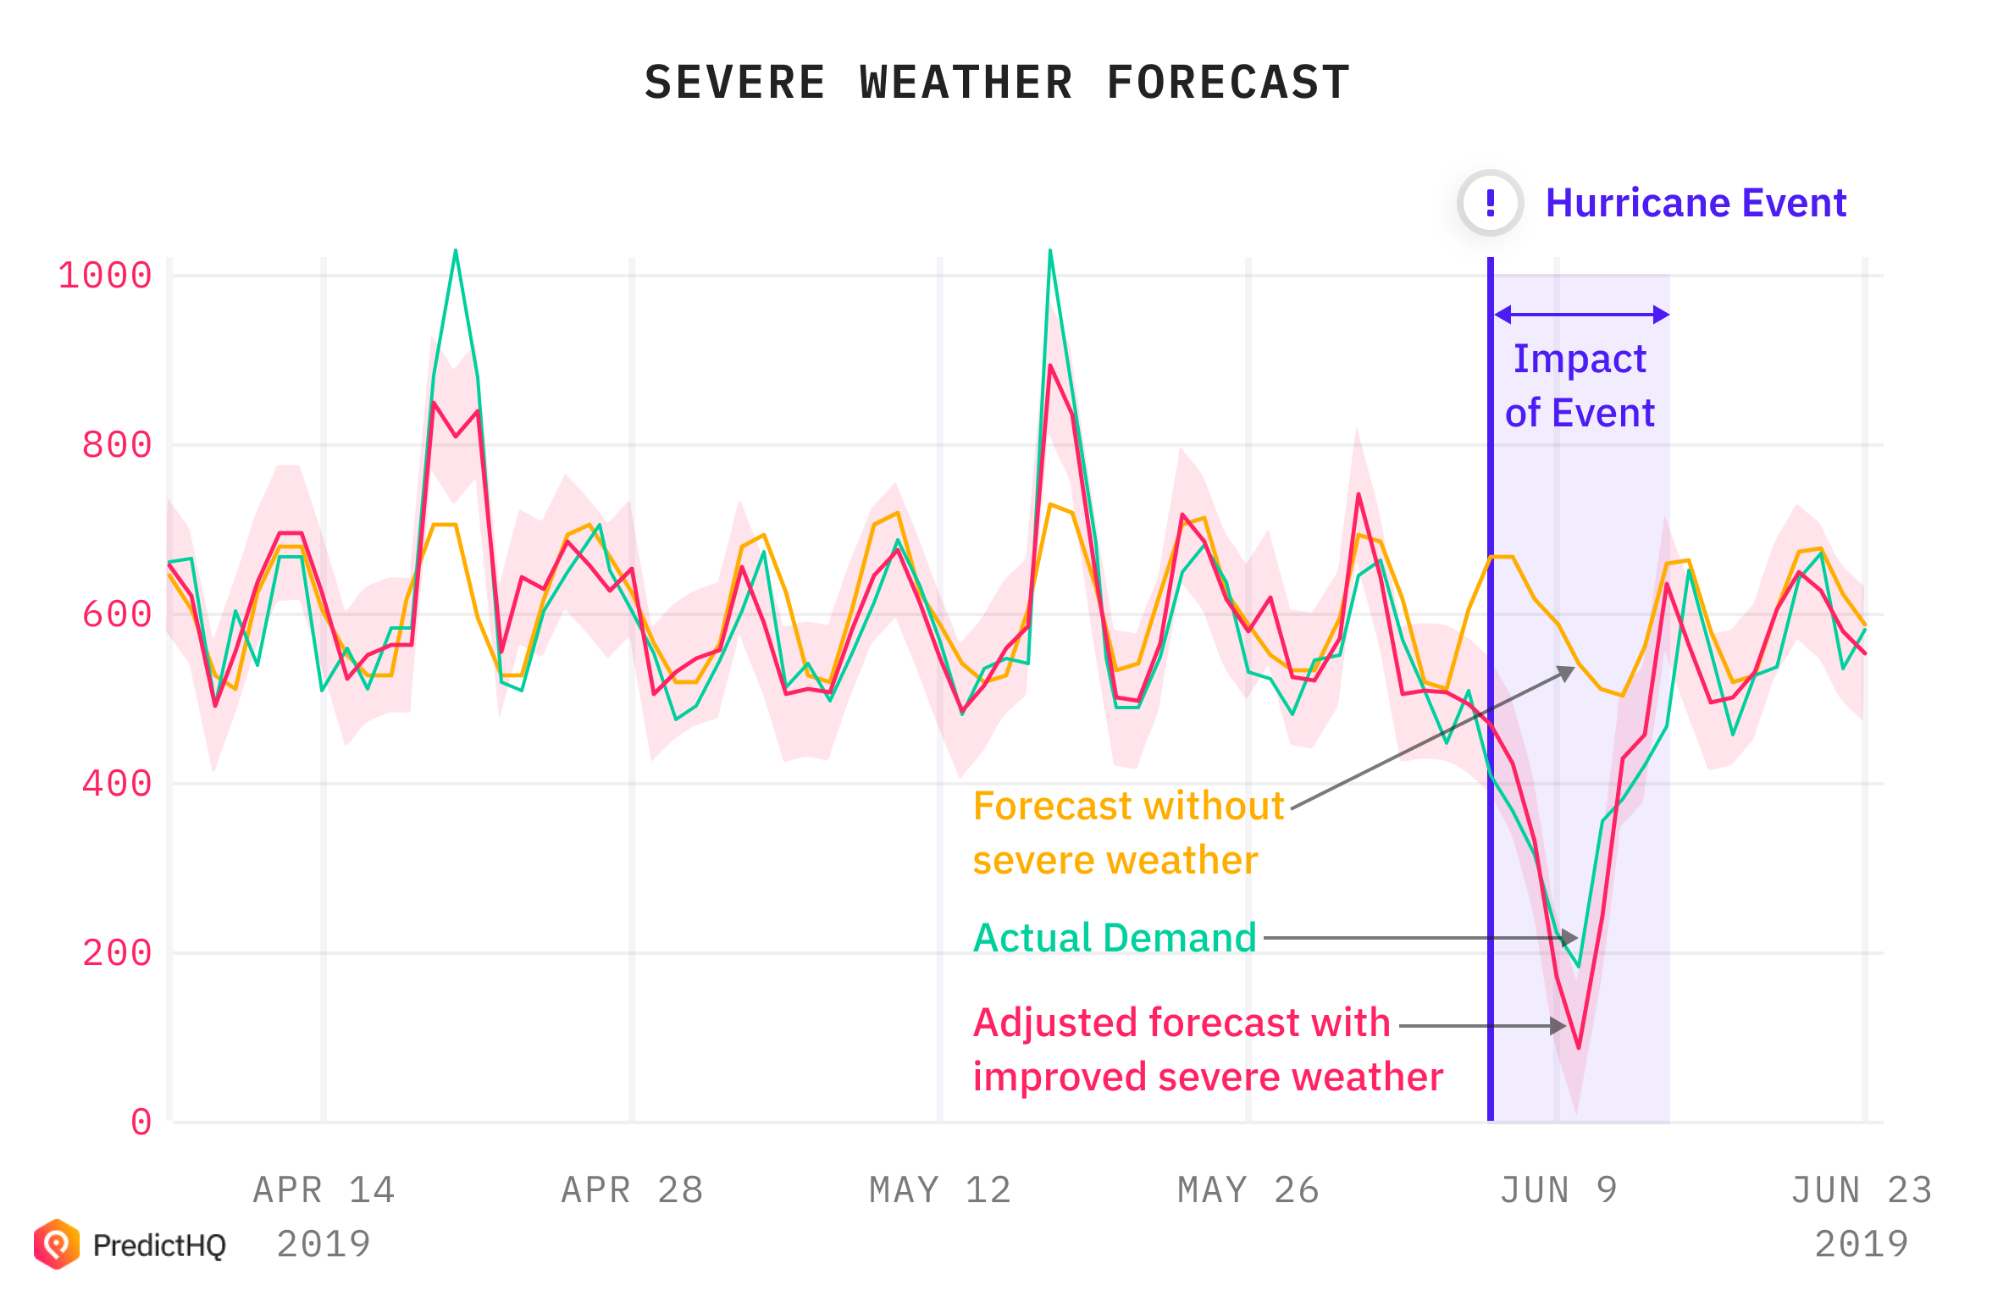
Before Demand Impact Patterns, customers could ingest severe weather warnings, and then build their own rules around demand going up or down on the day of the event. The challenge was those rules would at best be an informed guess. But we all know demand is impacted differently for different events. Duration and severity of impact vary based on the event, its intensity and the location of an event.
But you can’t power a machine learning model with a general understanding or guess. You need information - you need numbers.
Our data team built a reliable, rigorously tested set of information that forecasting models could ingest so companies could stop guessing and instead be able to update their forecasting models as soon as accurate information about disruptive events becomes available. At a glance:
Demand Impact Patterns are a demand impact graph that is available with every severe weather event in the US listed in PredictHQ severe weather data. This is 25,000+ events a year.
It makes the impact, both its duration and its degrees of severity, model ingestible and actionable.
It can also be used by teams to quickly understand the scope of an event, to make better informed decisions.
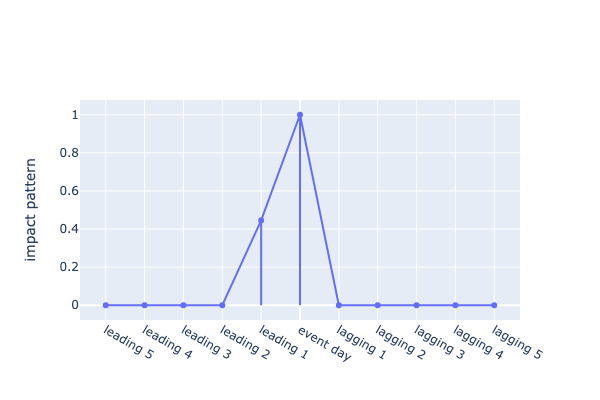
For example, here is the Demand Impact Pattern for a heatwave. Please note it may vary slightly, depending on the event’s location, seasonality and intensity.
It shows that while the impact is the highest on the day of the heatwave day or days itself, there is a steady build up towards the event. These also need to be factored in to avoid over or under forecasting. It’s also an event with no lagging day impact, which is distinct from say a flood or a severe winter storm.
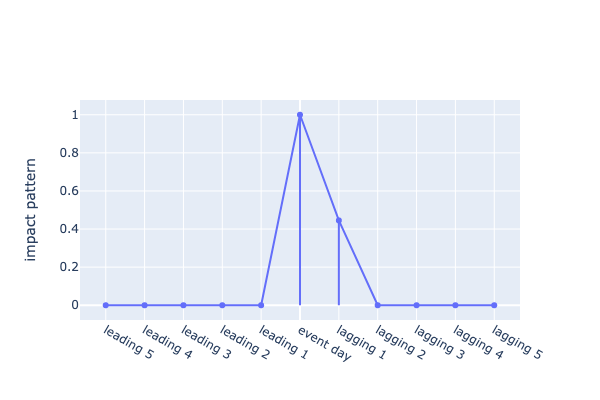
For example, a thunderstorm has almost the opposite impact, with no notable leading day impacts but a slower recovery to pre-event demand levels.
Please note we do not specify the nature of the demand impact. For some of our retail customers, such as those in grocery or home goods, there may well be a surge in demand as people prepare for a severe storm, whereas few people are heading out for a burrito or to pick up take-out in the middle of a severe storm.
These generalized impact patterns are the new baseline for our retail customers to inform their models to better understand and mitigate the impact of severe weather. So an obvious question is given how enormous the savings are of properly adjusting your plans to severe weather, why haven’t major retailers done it already?
Why Demand Impact Patterns almost wasn’t possible
In this article, I explain the extensive research, feature selection and testing my team used to overcome this challenge. We work with some of the largest retail chains in the world, and when we shared we were working on this project, they were excited but also wary. Many had attempted projects like this in the past, and hit a wall pretty swiftly: data scarcity.
Equipped with our years of verified severe weather data and demand data from thousands of retail stores, we were able to build this new intelligence feature for our data. Severe weather is enormously costly for retailers, and until now there was no ingestible and explainable data set for tackling its true impact.
We identified 58% of the thousands of stores we tested could generate significant improvements from better factoring in severe weather events as they emerge. This could be achieved in two ways:
Using severe weather to better understand previous demand data, to identify and remove the impact of severe weather that leads to inaccurate forecasting.
To better respond to severe weather events as they emerge, enabling companies to become data-driven and proactive in their approach to mitigating impact.
How to use Demand Impact Patterns to take control of severe weather impact
While Demand Impact Patterns was complex to build, it’s simple to use. Now, rather than ingesting a severe weather event into your forecasting model and either assuming the event will have impact only for the day or the event, or having to construct how long it’s likely to have impact, you can ingest the full generalized scope so your models can make adjustments to relevant stores at scale.
This means a flood warning impact will go from 1 day, the day of its predicted arrival, to multiple days, each with a loading based on its severity according to our Demand Impact Pattern. This gives your models a more accurate baseline for building automated responses to it.
For operational users, you will be able to see the Demand Impact Pattern alongside every Severe Weather event in the US in our Control Center platform. Use this to inform decisions around how to respond to incoming severe weather impact, as well as to better understand your historical demand and account for anomalies.
Explore our data science guides for Severe Weather here. Get in touch with our team if you need to take control of severe weather’s impact.


