Use intelligent event data to drive down your forecasting error rate by 10-20% in weeks


Accurate demand forecasting at scale requires machine learning models and ruthless prioritization of the features you build into the model. Every additional variable – unless perfectly related to the outcome metric (which most are not) – will provide less value as the model gets smarter. You need to work out which features provide significant value fast so you can drive down your forecasting error rate. Let me tell you about how intelligent event data does exactly that.
Intelligent event data is powerful demand intelligence to better understand your company’s environment, making your models more accurate. Over the last month, we have run the below process with a range of companies including quick serve restaurants (QSRs), food and beverage consumer packaged goods (CPGs), transport companies and accommodation providers and all have achieved a forecasting error reduction between 10% to 20%.
Better understand each site’s environment at scale to reduce demand forecasting errors
Accurate demand forecasting is beset by volatility driven by many factors. The more you can isolate and understand each factor, the better you can calibrate your forecasts to future demand. For example, for a major QSR we have been working with, their demand is impacted by events that cause both increases and decreases in sales:
Sports games and community events near stores can send demand up, especially when they start or end near key meal times.
Severe weather can send orders plunging.
Televised sports games can drastically shift orders from in-store to delivery.
Public holidays can send orders soaring, while key observances may lead to a noticeable drop-off.
Factoring in the impact of events on demand needs to be data-driven, as there are so many different kinds of impactful events. What causes an increase in demand for one may not cause an increase for another. For example, severe weather may send in-store orders plunging for some stores, but delivery orders rocketing up for others. Adding events as a feature into your existing forecasting models enables you to:
Discover what is driving your demand anomalies and causing errors without building a new model or extensively updating your existing ones.
Immediately understand what steps your teams can take to prevent these errors and fix your forecasting.
The methodology detailed below has enabled customers across several verticals to arrive at a forecasting error reduction of 10% to 20% - saving millions of dollars after a fairly straightforward series of experiments to discover their catalysts of demand.
How to reduce forecasting error rate by ~20% in four steps
1. Determine how to capture the value events provide in a time-to-value oriented approach
The role of any company’s data science team is to maximize model performance; work with data engineers to ensure the robustness of the forecasting system, and quantify the benefit of new data sources to improve model output, such as forecasting methods.
The existing workflows to integrate event data that simultaneously address all three of these objectives is to merge and model forecast grade quality data such as PredictHQ’s demand intelligence alongside the existing ETL (extract, transform, load) processes to compare the performance of newly enriched models against old models.
This chart shows what that standard process looks like:
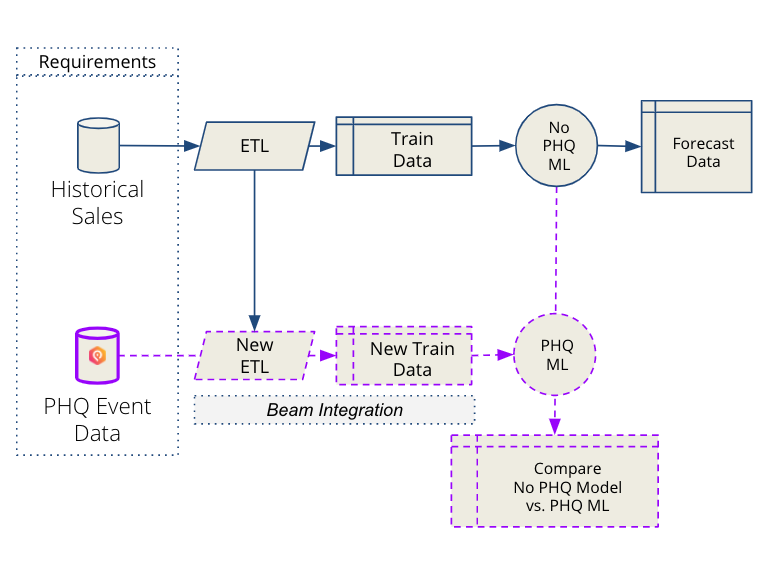
When working alongside new partners, the PredictHQ team aims to enable our customers to see significant, quantifiable value from our data in around two to four weeks.
We do this by understanding the value event data brings specific to the customer. Event data is highly localized to each location a company operates in. The goal of adding intelligent event data into your model is not to change the instances and ways in which the models work well. The goal is to correct the instances where substantial forecasting errors are occurring with greater context.
For more information on how to query our API and set your data science team up for success with an understanding of which events to pull, how much historical data to use and ideal radius sizes for your business, you can refer to our Documentation.
2. Establish a clear criteria for success
The methodology below is a great way to explore and access the value of data quickly and efficiently i.e. without updating your core models or investing a huge amount of your data science team’s time in building new models.
The minimum level requirement necessary to determine the impact of events is historical sales and historical forecast data. Using demand causal factors data to predict historical demand, you will be able to identify where events led to anomalies that appear as significant errors in your historical transactional data. Once you have identified this impact, you will be able to update your future forecasts by accounting for this with an event-only model.
We start by using highly interpretable machine learning methods to create a prediction of demand using only event data.
It is critically important to be clear on which metrics matter for this experiment. Mean absolute percentage error (MAPE) is one of the most common central metrics used by companies to serve as a representation of whether forecasts are improving over time. The lower the MAPE, the better the forecast.
Three different measures of percentage error can be used in order to determine the impact of events. These include:
The mean of the original error vs. the adjusted error
The standard deviation of original error vs. adjusted error
The sum of the absolute original error vs. the sum of the absolute adjusted error
3. Create and evaluate adjustment predictions made based on event data
With your criteria set, it’s time to gather both your error data and examine the bias of the errors towards under forecasting or over forecasting.
With this identified, follow this process:
Collect PredictHQ’s data:
Call the PredictHQ API to collect the location specific data needed to run this analysis and create the Aggregate Event Impact table (daily granularity) using our verified event data.
Merge this data alongside your daily granularity error data.
Then, create and evaluate adjustment predictions made based on event data.
And then follow this process:
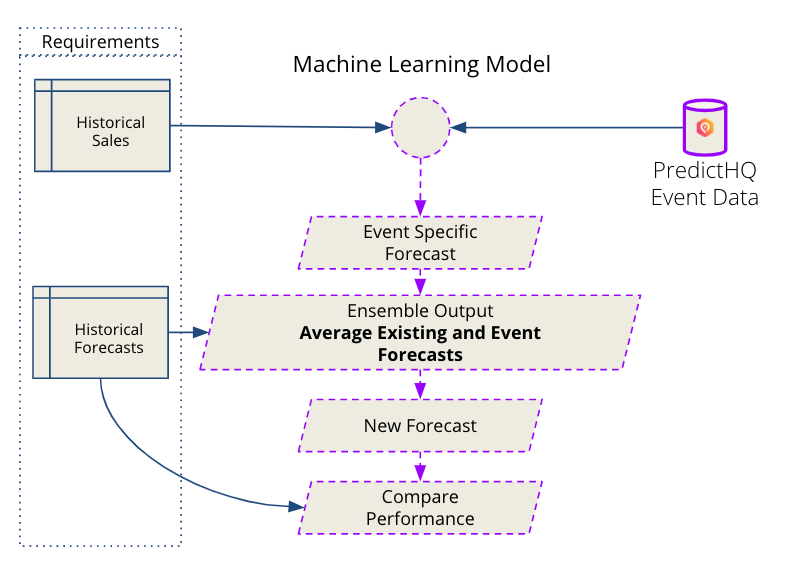
Select a regression (or another machine learning method you prefer) to create a prediction of actual sales based only on event data.
Forecast the prediction.
Using your favorite ensemble technique, integrate the original forecast and the event-only prediction. Taking the average is a good starting point.
Calculate the increase or decrease in percentage error that occurred because of the adjustment based on this new, event-informed forecast.
Aggregate and evaluate these statistics across the entire test set using the three metrics mentioned above (mean, standard deviation, and sum of absolute error) for both the original and new forecast.
Derive feature importance statistics from the event-only model to understand what kind of relationships exist between specific event categories and historical demand.
Continue to repeat this workflow by incorporating new event features to continuously increase the amount of forecasting accuracy that events bring to your forecasts.
4. Assess results
The outcome of the final three steps of the previous section should produce clear statistics and performance metrics that reveal how events impact your company’s forecasting accuracy. It also demonstrates how much a pipeline can be improved based on this time-to-value oriented approach.
For most of our partners who tried this model, their forecasting error rate reduced substantially. They were then able to take these learnings and create more accurate forecasts.
This method’s quick analysis should not affect your overall pipeline, so it minimizes how much time your data science team needs to invest to assess the value of incorporating event data into your forecasting.
Errors will always occur in demand forecasting, but reducing it substantially translates into millions of dollars through adjusting your staffing and inventory strategies down for quieter periods, and up for busier periods to meet demand. Adding intelligent event data into your model enables you to identify a more accurate baseline and a more dynamic and resilient demand forecasting approach.
Prioritizing features to add to your forecasting pipeline and data lake
One of the temptations of machine learning based approaches of demand forecasting is to keep adding features to your model. However, making a pipeline ever more complex with additional models might actually hurt performances. Focusing on the highest impact data sources such as events, weather and key competitor campaign tracking is key.
It’s important to note also that because event data illuminates the environment your company operates within, it’s important not to adjust on a relative basis. Demand intelligence highlights what is driving anomalies and fluctuations in sales, and provides context that no model powered purely by historical transactions can.
PredictHQ covers 19 categories of events and provides verified and standardized data to customers including Uber, Domino’s, First Data and Accenture.


