Getting more details on a date on the Demand Analysis (Beam) graph
If you click on a point on the graph it will bring up details for that date:
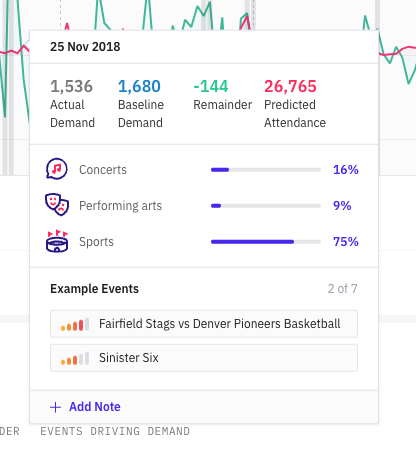
This shows you the % of events per category on a given day and shows some examples of events on that day.
On the top right just above the graph are three filters related to the three series, that you can switch off and on accordingly.
Note that by switching a filter off, that series is removed from the graph, and hovering over the graph will not show information about that series.
Once satisfied with the selected filters, scroll down the page to see a detailed description of the information displayed by the graph.