See event trends in Control Center
Demand surge data is available via our Features API and the Event Trends feature on Control Center.
How to use Event Trends data in Control Center
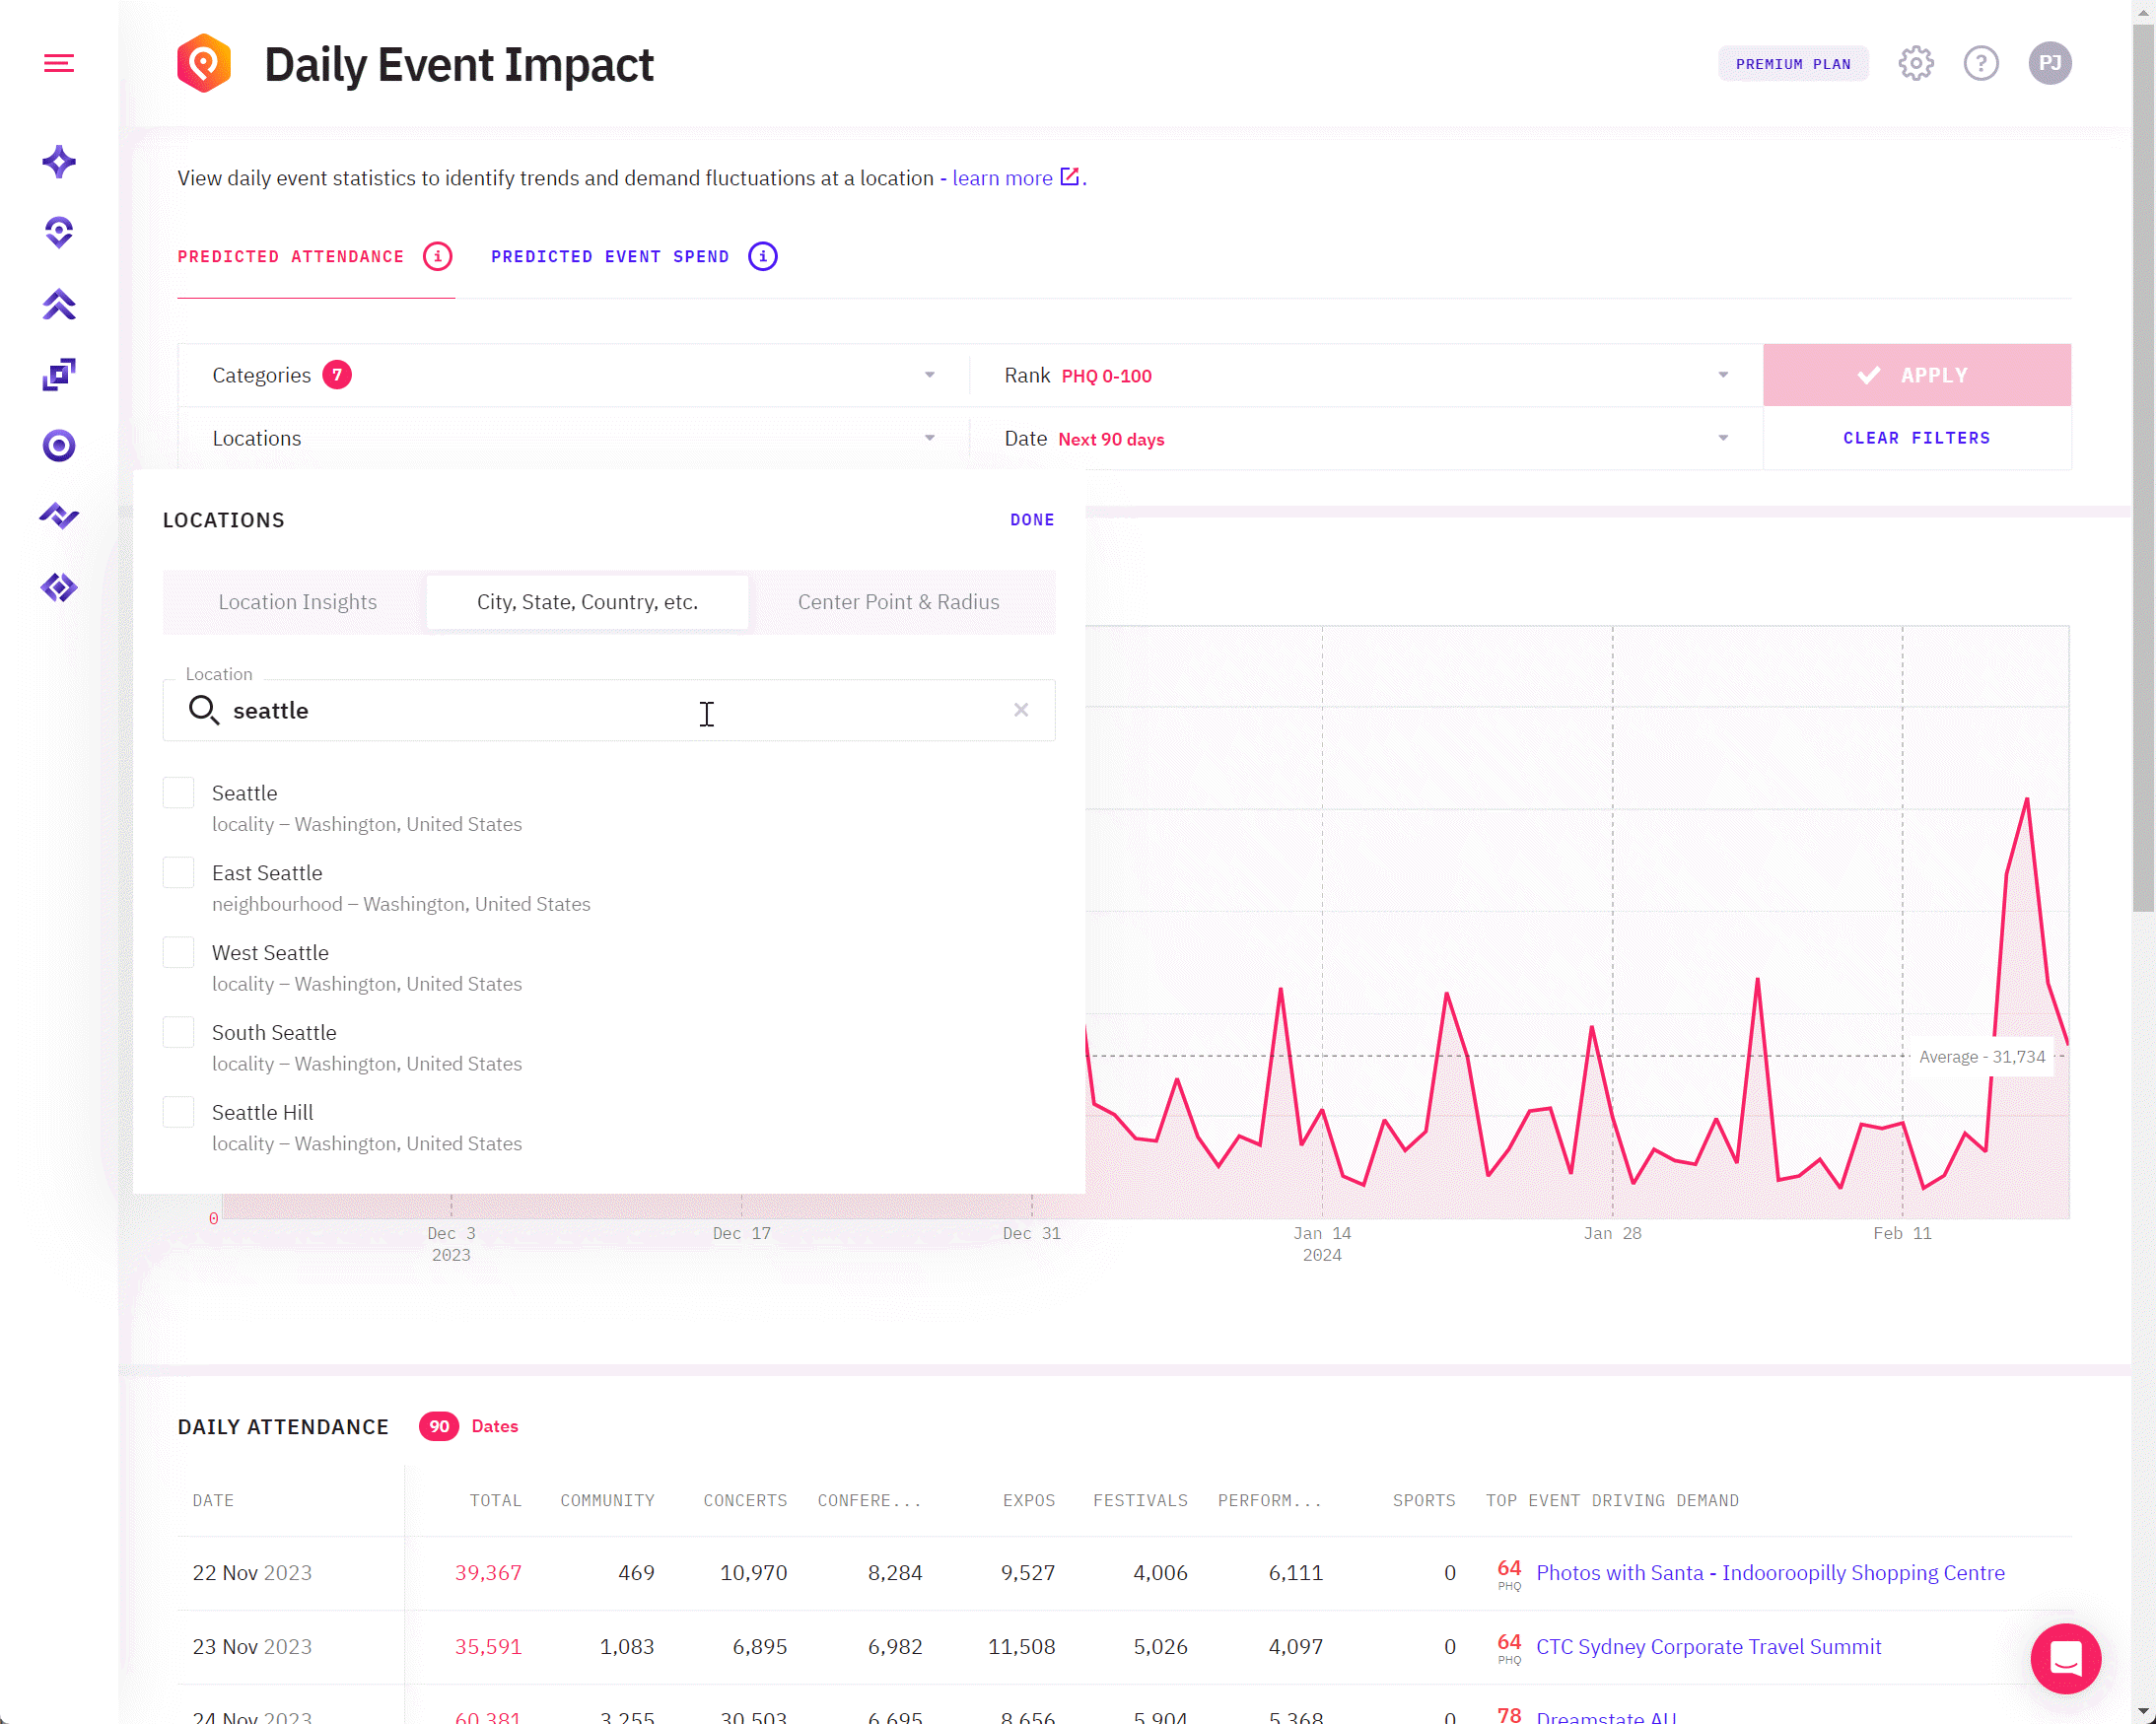
PredictHQ's Event Trends feature (previously known as Daily Event Impact) allows you to view daily event statistics to identify trends and demand fluctuations at a location. This will show you if demand surges are coming up at a location or if there are times with lower demand. You can use it to see trends in the demand around your business location such as a store or hotel. You can also look at a wider area like an entire city, state, or country.
Event Trends shows you statistics on the total impact per day caused by all events in the selected location and period. There are two types of statistics supported by Event Trends which are:
Predicted Attendance - shows the total amount of people attending all events at the specified location per day. For example, if there were 10 events each with 10,000 people the total predicted attendance on the day would be 100,000 people.
Predicted Event Spend - shows the total amount of spend generated by events in the supported industry per day.
Because PredictHQ contains extensive information on future events and historic events you can use Event Trends to look at spikes in demand caused by events to help prepare your business for increased demand caused by demand surges or just busy days.
To see Event Trends in Control Center, follow these steps:
Log into Control Center (control.predicthq.com)
Select the "Event Trends" icon from the sidebar.
Set parameters for your search. Select the location, categories, date range, and rank. We recommend selecting a wide enough date range to get meaningful results (at least a month) - our default date range selection is 90 days.
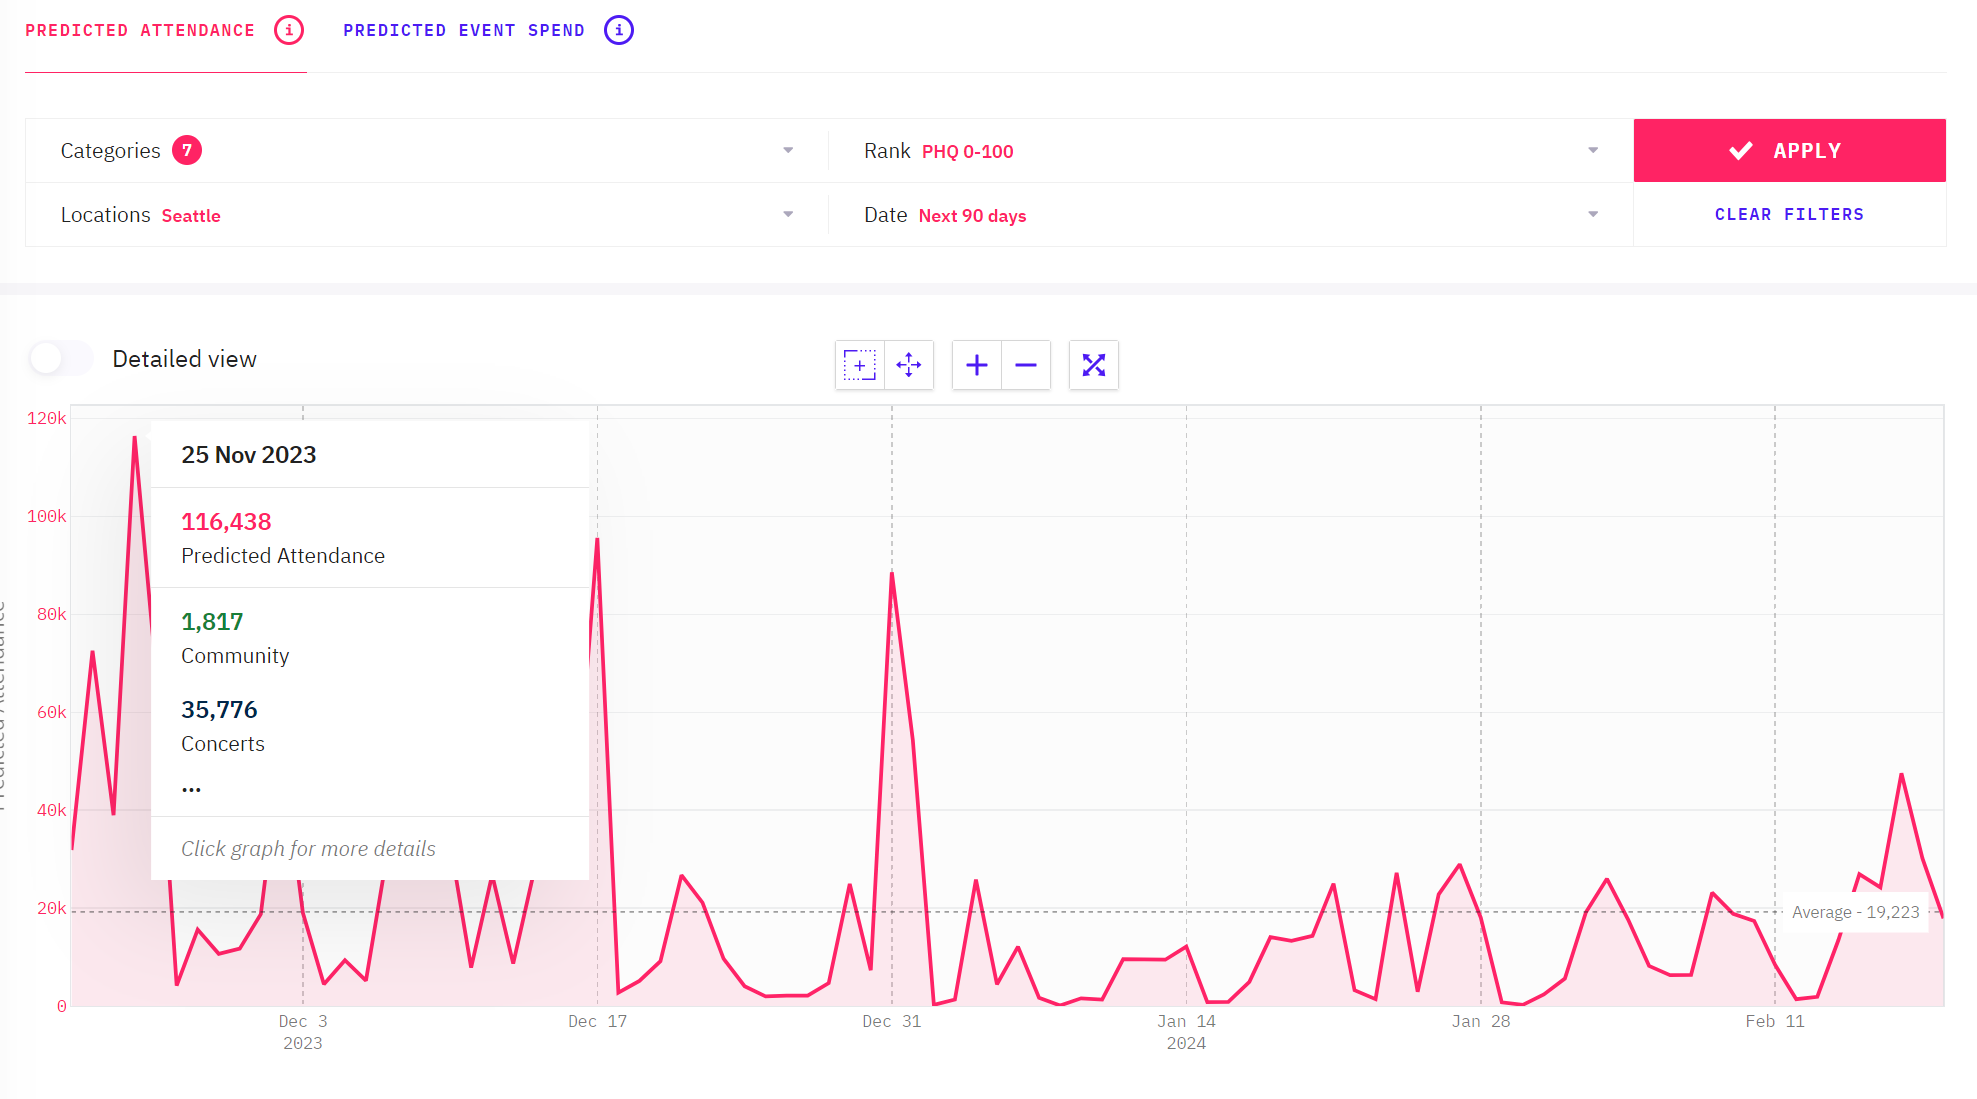
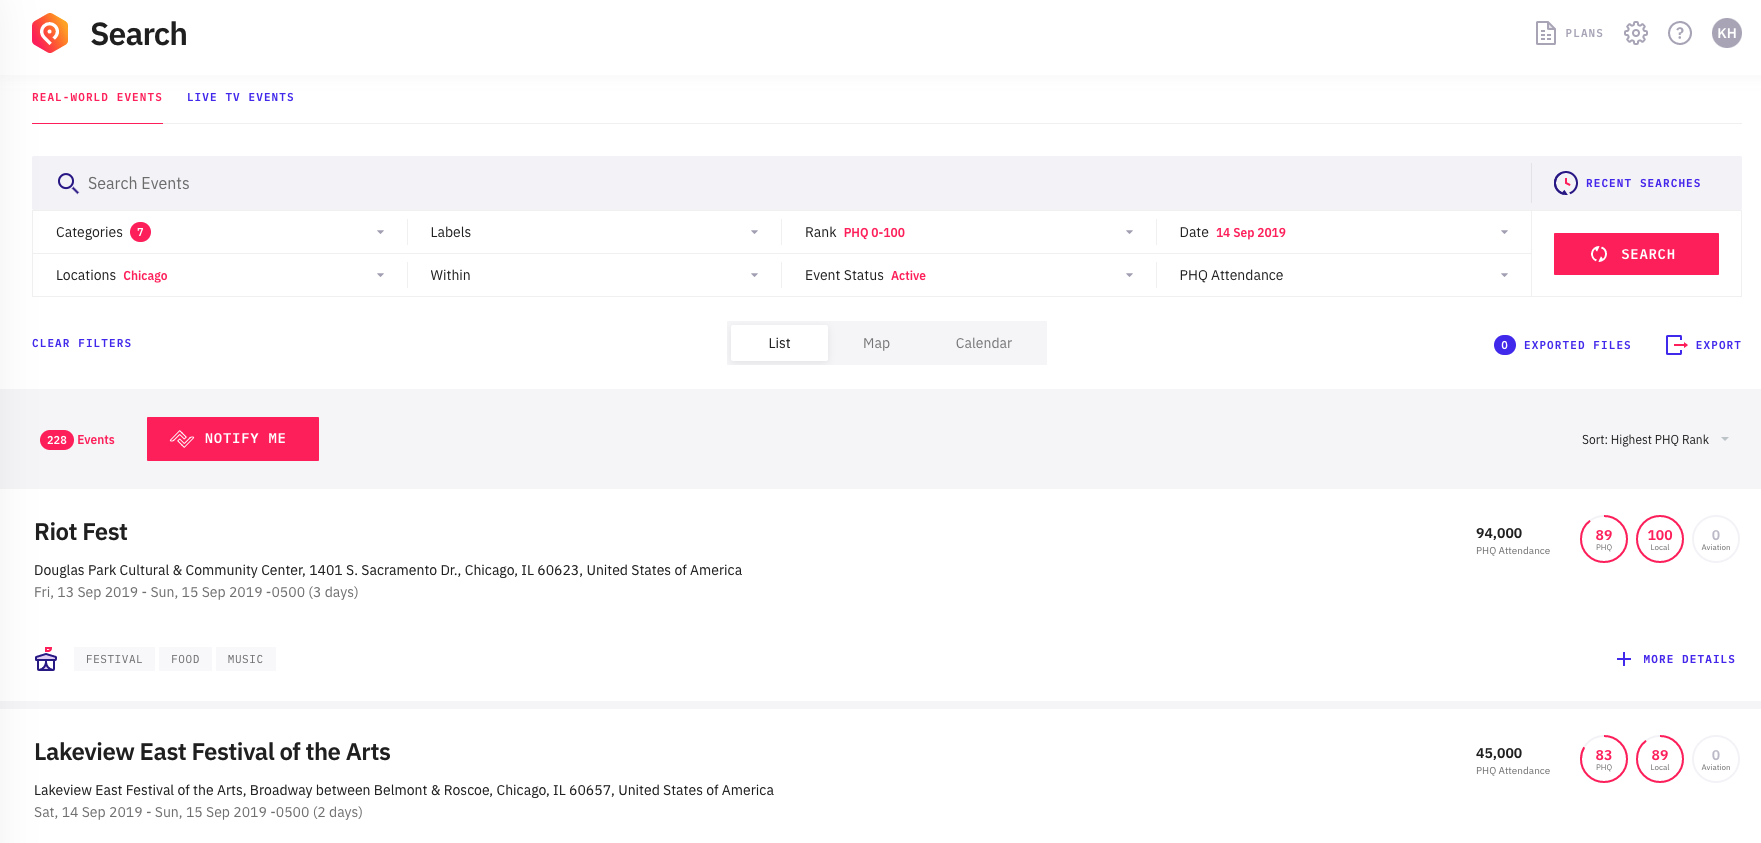
You can hover over the results in the graph to see more details. In the example below you see that the results represented in the graph show that there was a peak day on the 25th of November, with a total attendance of 116,438 people.
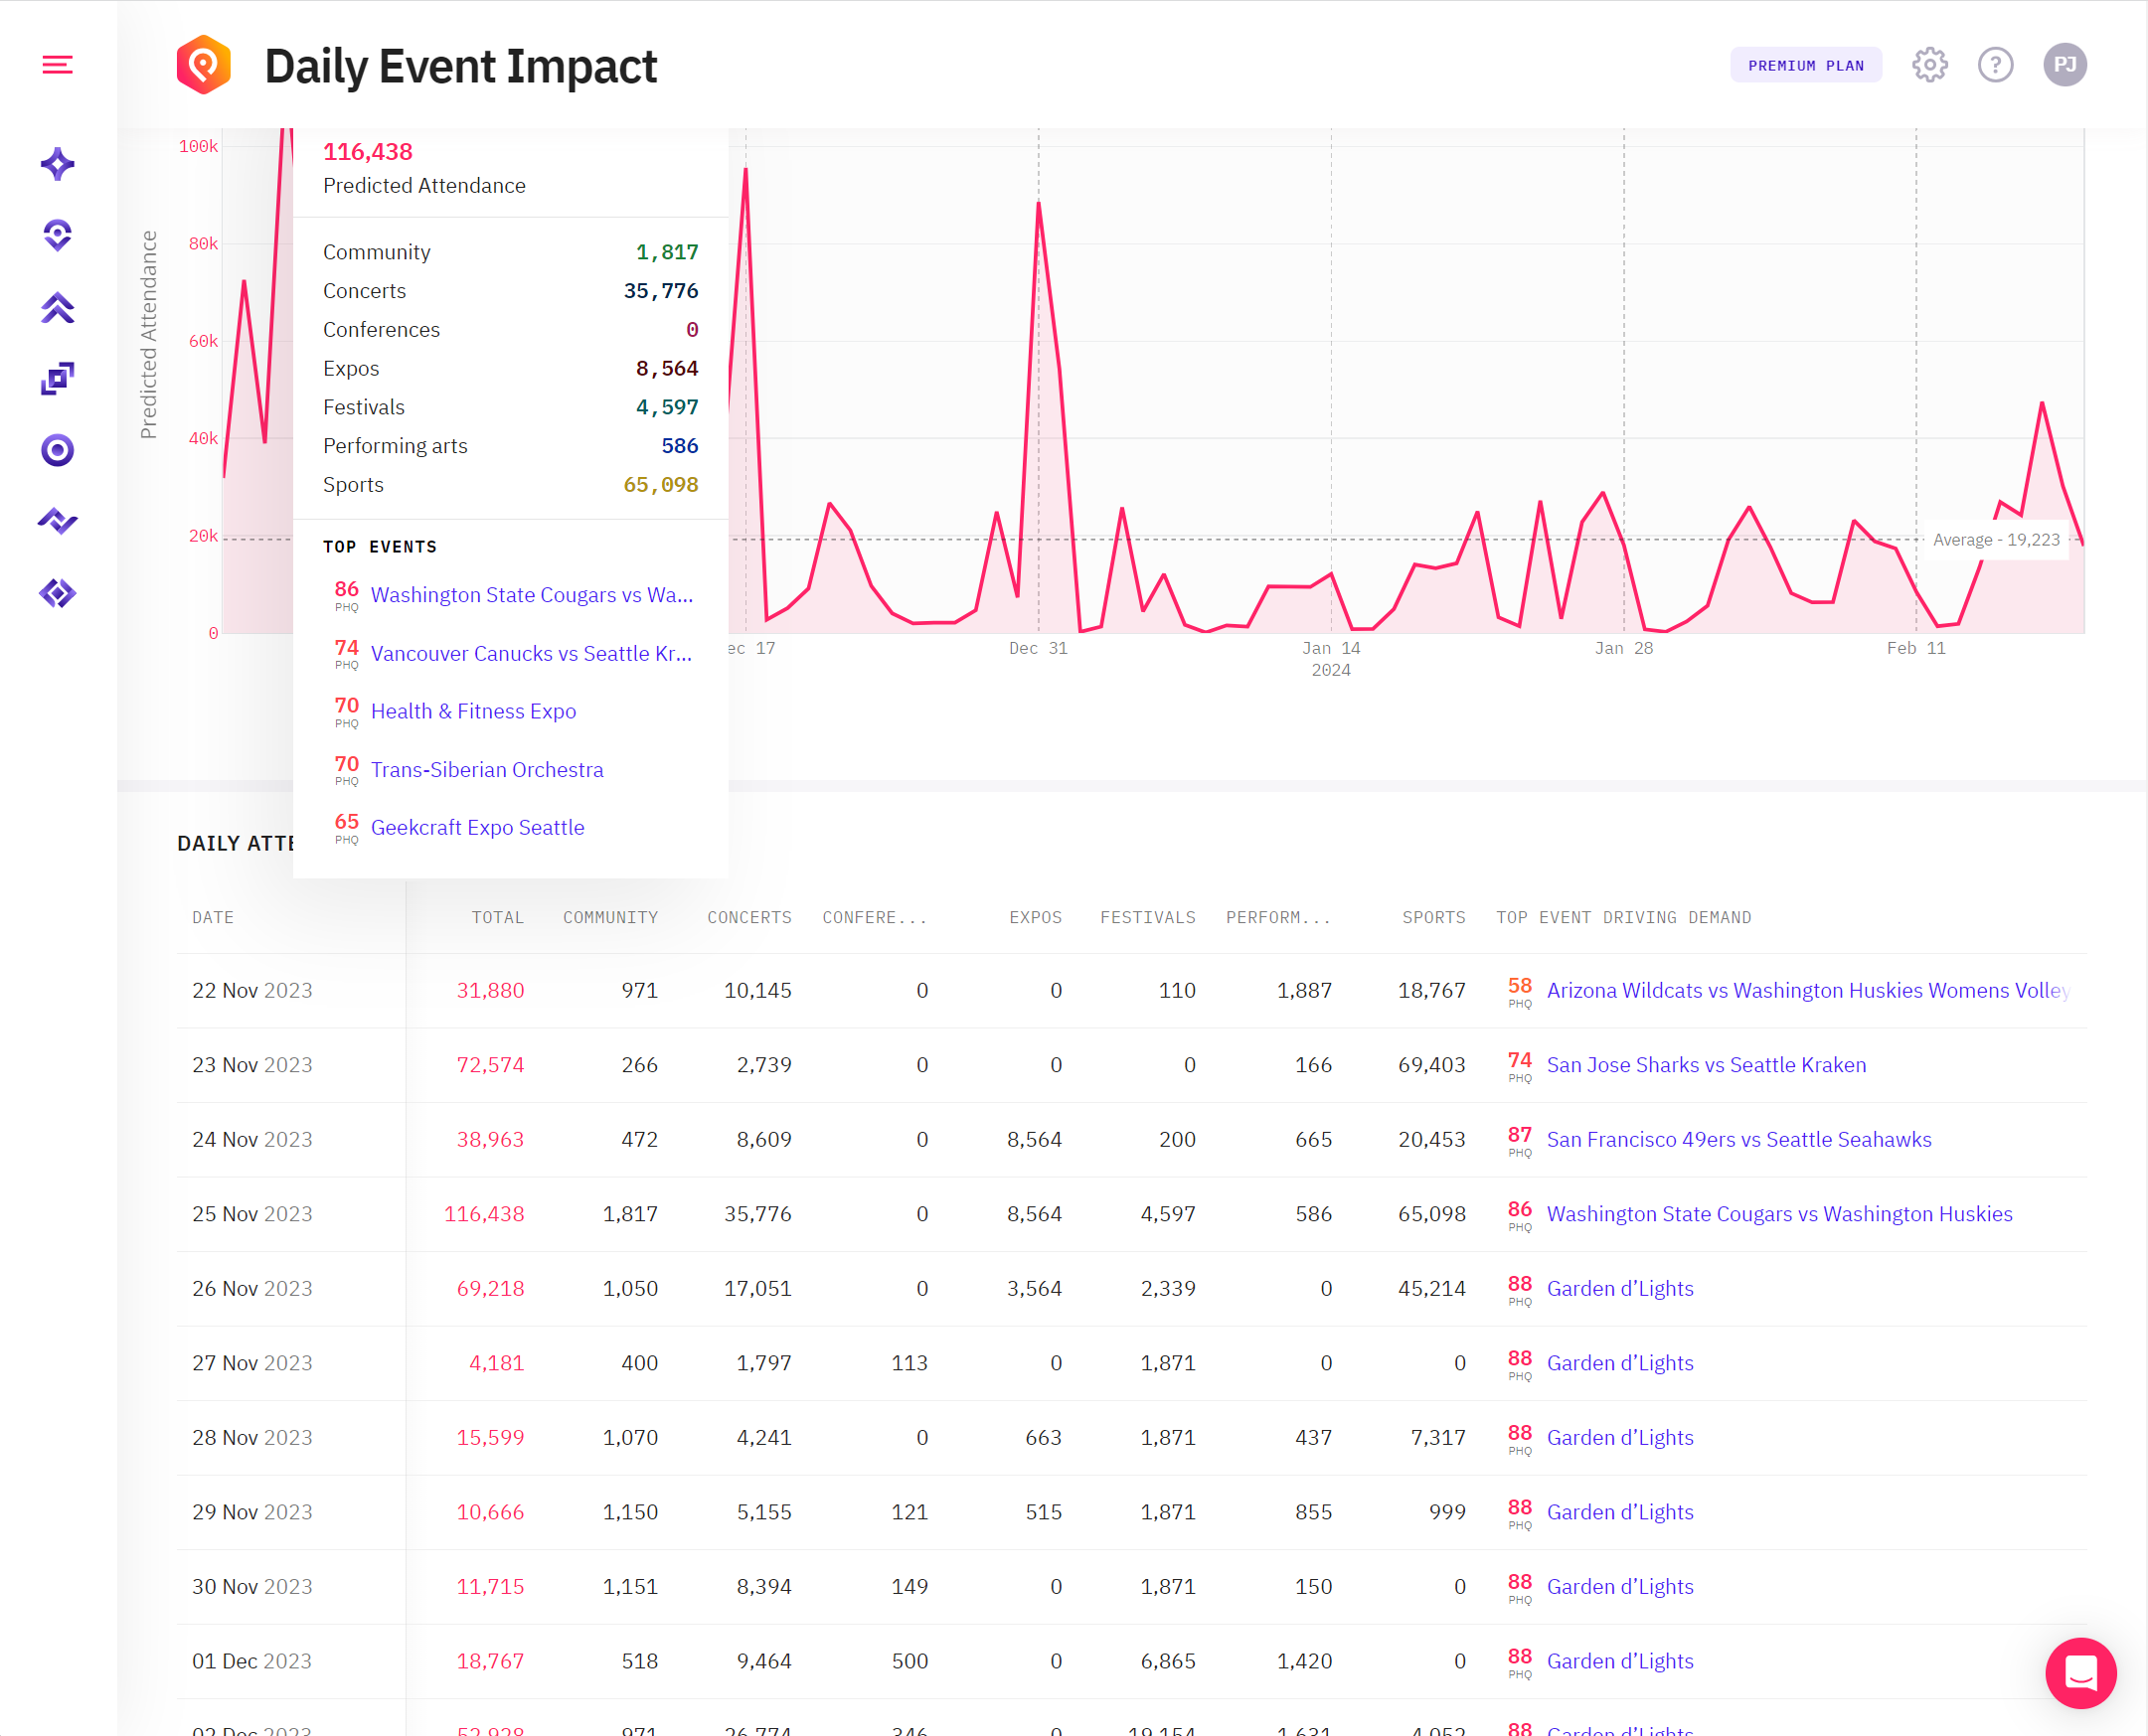
You can click on a point on the graph to see more details. You can also scroll down to view the table below to see what types of events (categories) are contributing to the demand on a given day. In the case of the example below, sports and concerts are the biggest contributors to the total attendance on the selected day.
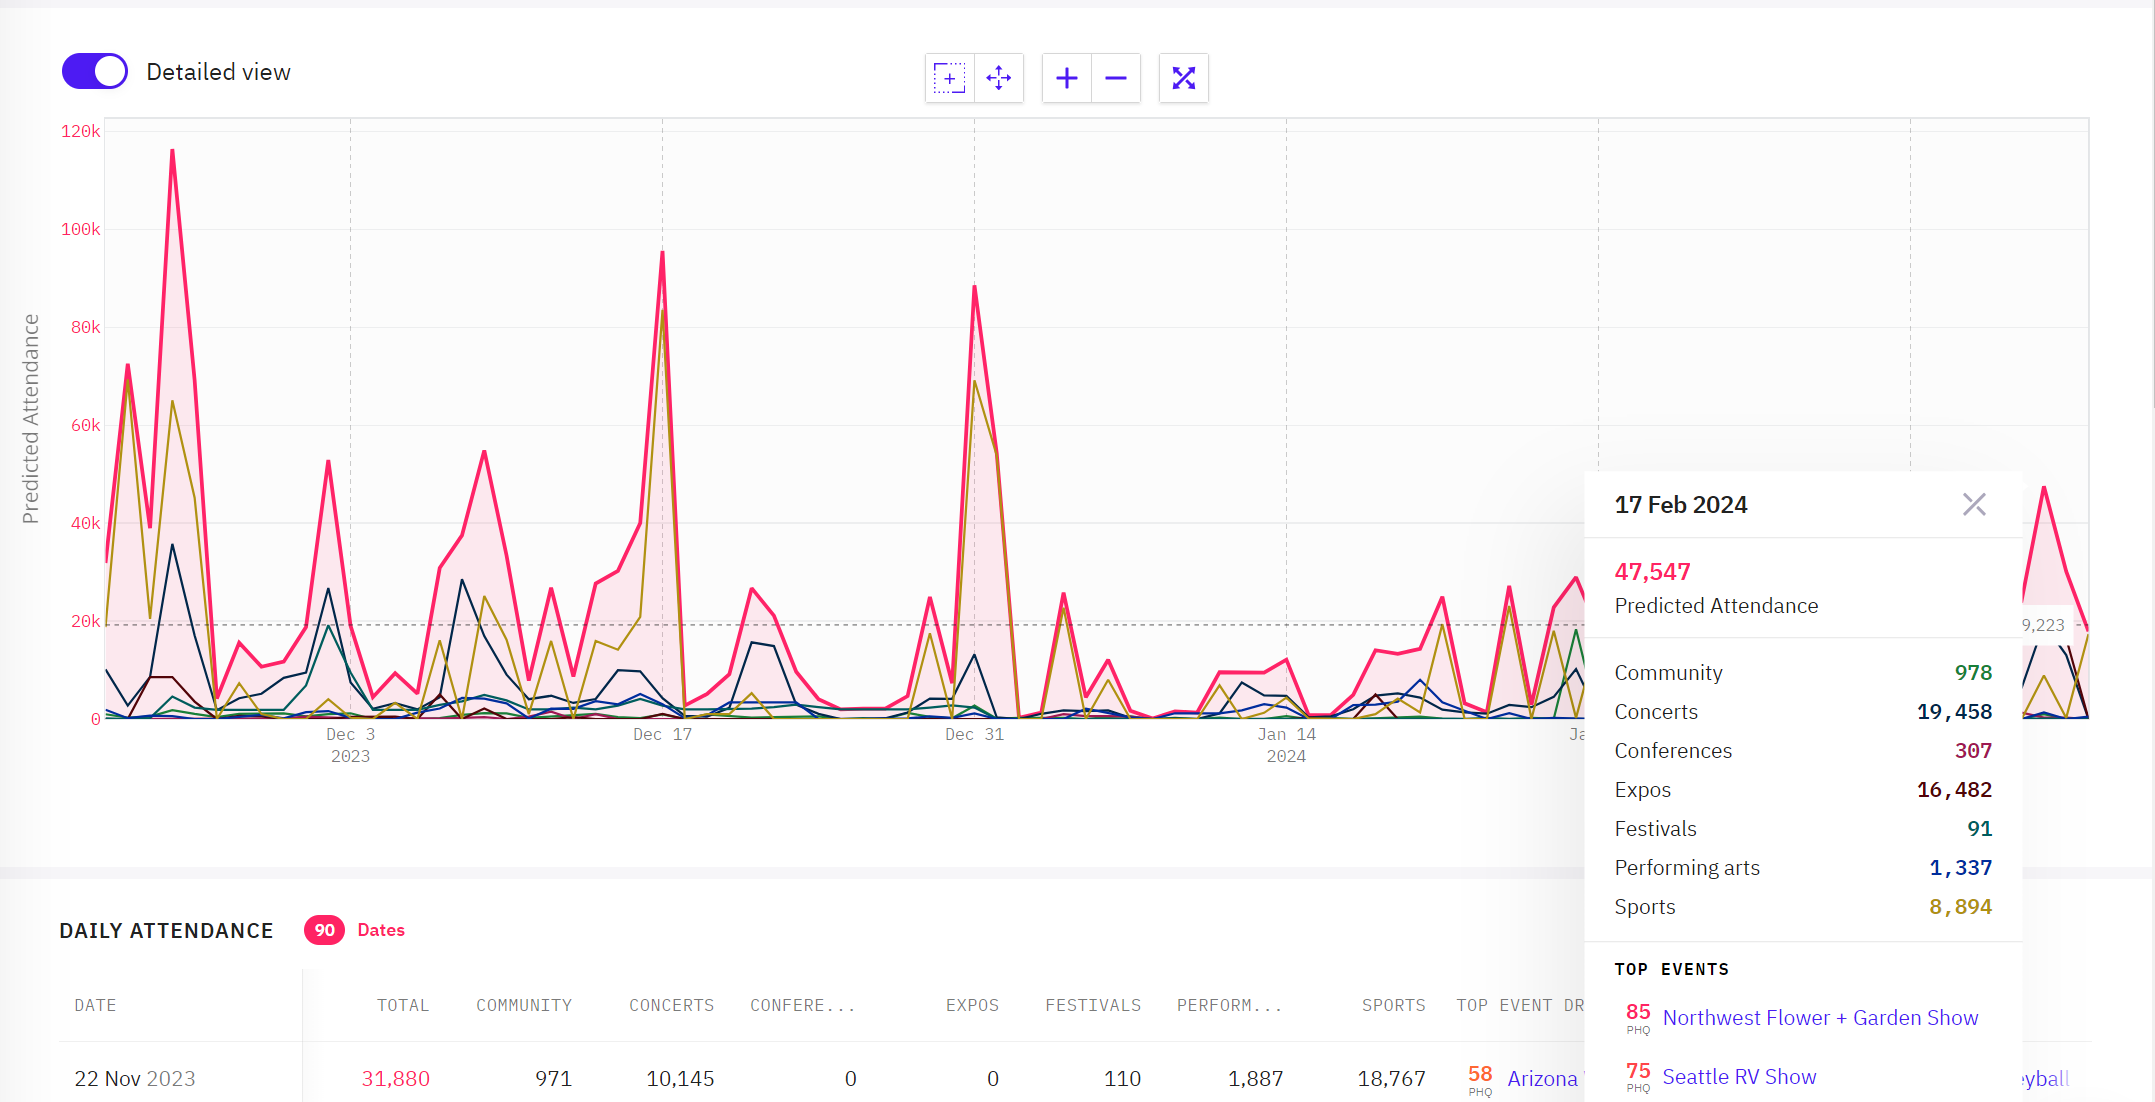
You can also toggle the detailed view toggle to see the breakdown for all the selected categories or industries in the graph. For the predicted attendance view, this will show you lines for up to all 7 categories (unless you have used the categories filter to show fewer categories).
When you click on a point on the graph you see top events driving demand. This won't show all events on a given day just the top events by rank. Also, the table shows you the top event (based on PHQ Rank) driving demand on that day. To see other events driving demand on that day click on View All.
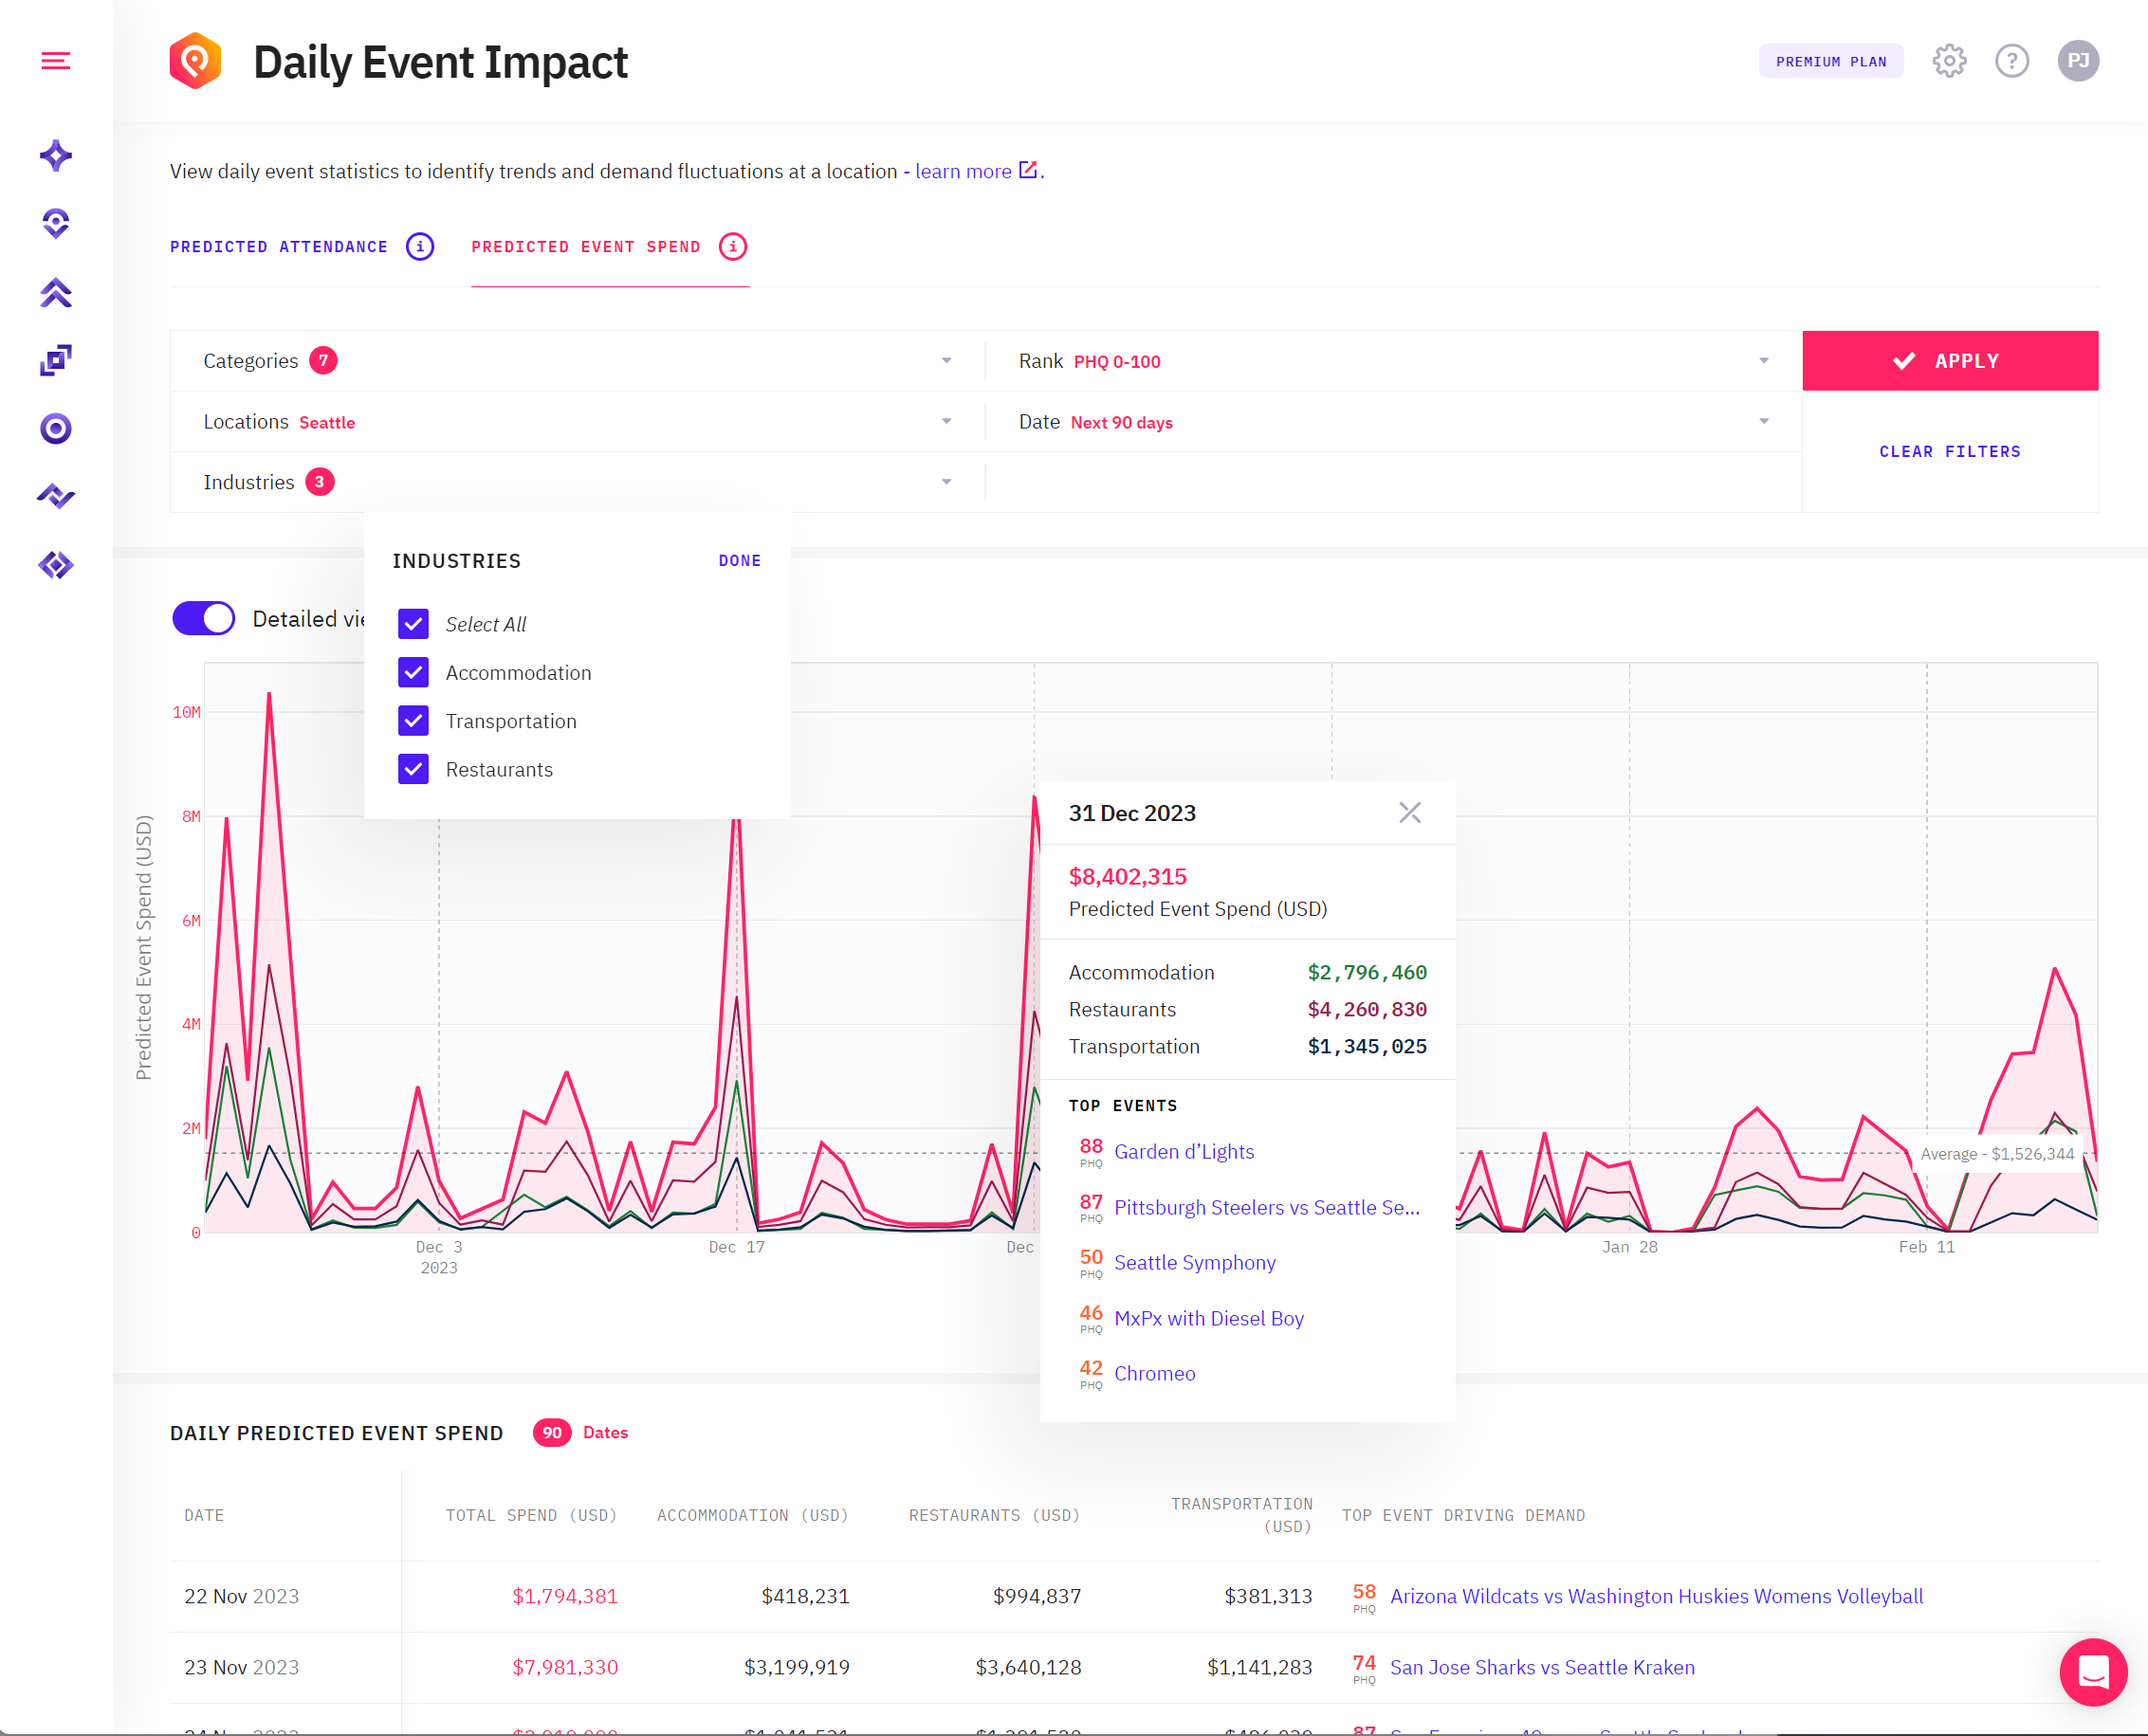
Viewing Predicted Event Spend
Click on the predicted event spend tab to view the Daily Predicted Event Spend information. This shows you the total predicted spend driven by the events happening around a location per day. Predicted Event Spend includes the predicted spend for the accommodation, hospitality, and transportation verticals.
You use the Event Trends feature in the same way as detailed above to look at spend. Choose a location, time range, and other filters to see spend for a location. You can use the industry filter to narrow down spend to just the industries that you are interested in.
Our Predicted Event Spend model takes into account many factors when calculating spend per day. At the core of this figure sits our market-leading global event coverage, predicted event attendance, local accommodation demand, third-party data, and more which culminate into a contextual and attributable dollar figure that can be used to power both insights and forecasting models.
Predicted Event Spend is calculated from our core PredictHQ data, enriched by local economic indicators and partner data. Find out more about predicted event spend in our technical documentation.
Export data from Event Trends
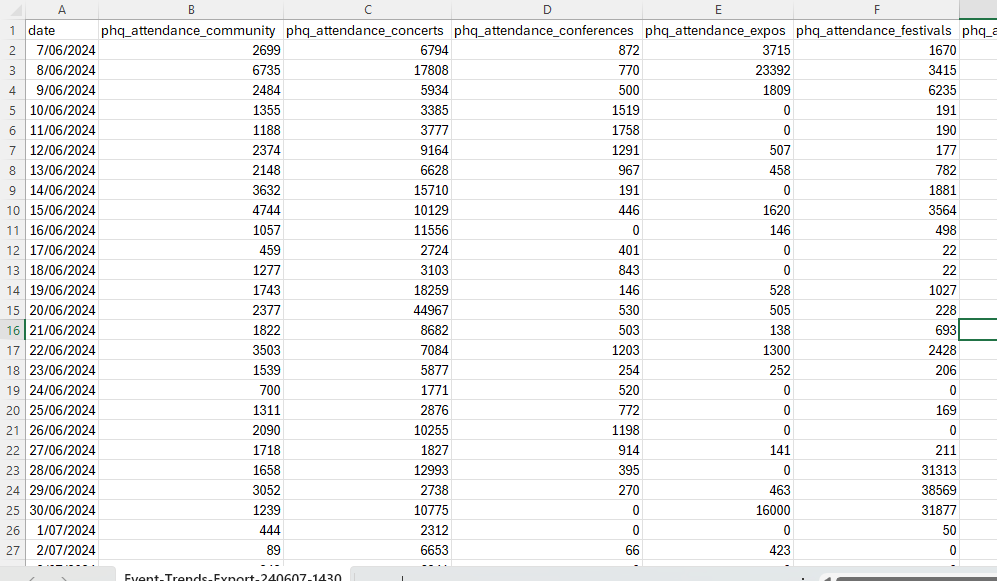
You can now export from the Event Trends page. Simply choose a location, set your filters, and then click Export Data.
This exports Features API data. Exporting historical data can be a quick way to get training data for training Machine Learning Models during R&D. Or to use the data in a Spreadsheet, BI application or some other tool.
The data format has 1 row per day and 1 column for each Features API feature for the attended event categories. See the Available Features in the Features API for more info on the data include in each column. See the example below.
Getting this data via the API
To get aggregated data on all events at a location from our APIs use our Features API. Access forecast-ready prebuilt intelligence and features to enable your teams to extract value from intelligent event data rapidly. The features API includes features such as the sum of attendance per day per category which you can use to get the same data as shown in the Event Trends graph. See our technical documentation for more info.