Viewing the table of results in Beam
Below the graph is a table of results in Beam.
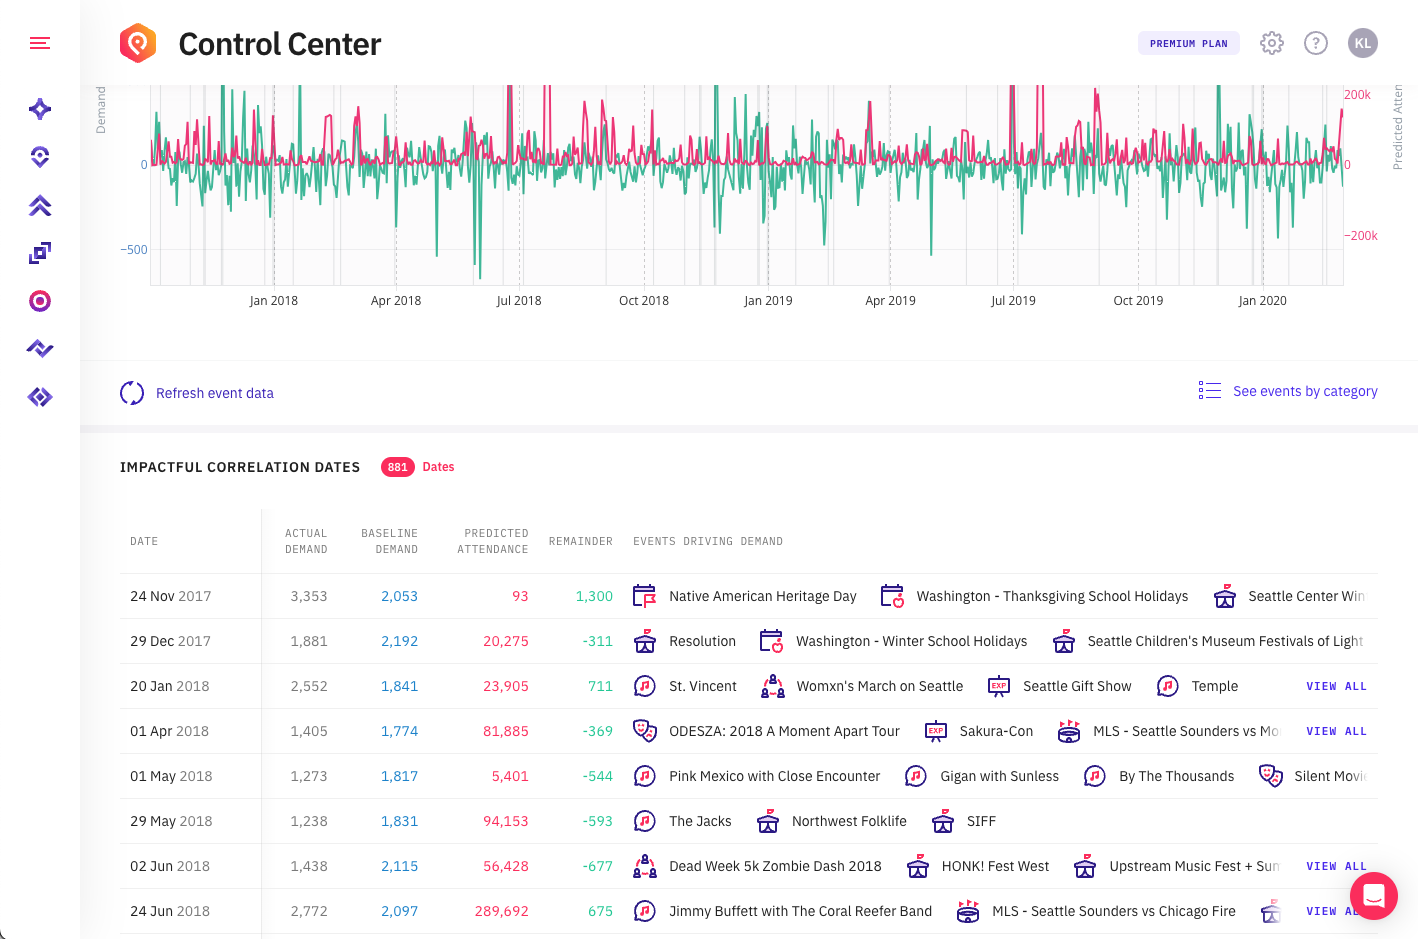
The table has the following information:
Date - The date
Actual Demand - The actual demand or total demand that was uploaded.
Baseline Demand - The baseline extracted by the Beam models from your underlying demand data. This will show the underlying pattern in your demand data with the remainder removed. It reflects typical demand without outliers.
Predicted Attendance - Reflects the total amount of people attending events within the location covered by the beam analysis. This is determined by the events within the radius used by the Beam analy
Remainder - Incremental or decremental demand value extracted for the given date. This shows demand outside the baseline pattern. This can indicate spikes or dips in demand that may be caused by events. This is part of the demand decomposition performed by Beam.
Example events driving demand - Shows an example event occurring on that day. This table will show the highest-ranked events first. The icons indicate the event category. Click on the event to view the full details of the event.
This table shows a sample of dates where there is a correlation between the remainder and the event impact on that day.