Using the Beam graph
Zooming in and out
In the Beam graph, you can zoom in on results and navigate the graph. When you place your pointer (mouse) over the graph you see the toolbar as shown below:
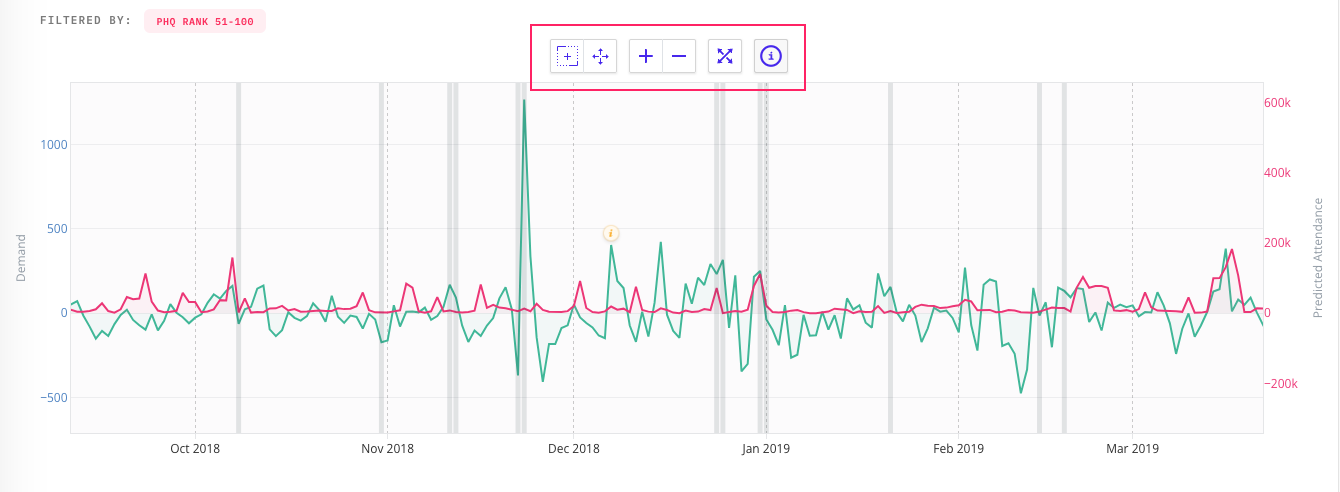
Using the toolbar icons:
The first icon with the + in the middle of a broken square allows you to select a range and zoom in on it
The 4 arrows pointing out - allow you to pan the graph - drag left and right
The plus and minus icons - allow you to zoom in and out
The 4 diagonal arrows - allow you to reset zoom (if you zoom in this goes back to the default zoom)