Coronavirus Recovery: Don’t Throw Out 2020 data –Train Your Models to Learn from COVID-19 Anomaly


The COVID-19 pandemic has catapulted our world into unprecedented times. Beyond the terrifying health situation, the economic impact is stark. Companies are dealing with exceptional circumstances and today I want to share some insight into how your data science teams should be updating your models to prepare for the recovery.
The massive plummet in demand caused by restrictions as the coronavirus pandemic has thrown businesses worldwide into turmoil. While it is still too early to know when the economic recovery may start, we are working with our customers to prepare their demand forecasting models and associated strategies – such as packaging, pricing, marketing, staffing plans and inventory management. Knowing when demand will start to recover in advance will be critical as many companies will need to rehire and upskill their team, as well as re-engage their supply chain.
We published a piece recently about the beginnings of a significant cluster of rescheduled events in September and October 2020. Many more new and rescheduled events will be logged over the coming months also. Events are very dynamic, so we will continue to update our API every minute to ensure it is always accurate.
This means companies need to be developing recovery plans now, and this will require substantial updates to their models. The PredictHQ team has been working with our clients and as our Chief Data Officer, I have been tracking this support closely. I wanted to share the most common themes in our feedback on effective recovery planning.
Resist the temptation to throw out data from 2020
Most teams have decided not invest much time into short-term demand forecasting over the next one to three months. I agree with this because the next few months will be chaotic because it is extremely difficult for models to forecast a key variable – government responses.
Most teams are instead focusing on updating their models for the final two quarters of this year, and into 2021. Several of the teams we have spoken with have mentioned dropping data from 2020 out of their demand forecasting models entirely and relying on 2019 and 2018 data.
As someone who has been working with time series modeling and anomaly detection for decades, I want to encourage you not to do this. This tactic is based on an incorrect assumption – that the world will return to exactly what it used to be prior to COVID-19.
Even if the world is very lucky and we can contain the virus as quickly as we hope to, recovery will take time. The ongoing fear of the virus, broken businesses and millions of unemployed people will have long-term impacts. Data-driven companies will be able to navigate this, but you can’t build effective strategies on incorrect assumptions.
Don’t ignore anomalies – train your models to guide you through them
Training your models to recognize and understand anomalies builds its intelligence for when your company encounters a similar impact. While we are unlikely to face such a severe global impact anytime soon, city or regional shutdowns due to severe weather and natural disasters can have huge localized impact. PredictHQ tracks both, and they are far more common than pandemics.
Investing time into training your models to understand the impact, duration and recovery rate for your business during abnormal circumstances, such as shelter-in-place mandates, will enable your team to make smarter decisions at scale faster.
You will need to decompose the COVID-19 anomaly to be able to build models to steer your business through it. The COVID-19 anomaly has three main aspects. Clearly understanding each will enable you to build models that work well.
The first aspect was the big drop in demand, so your model needs to detect the downward shift in the normal demand curve including long-term and short-term business trends as well as seasonalities.
The second aspect will be tracking the recovery rates and creating models to identify what your company’s is likely to resemble so you can be prepared.
The third aspect will be an increase of demand into the recovery, which will be spurred by the size-able volume of rescheduled events. Your company needs to move swiftly to prepare for rescheduled events so your model needs to pick these up immediately and accurately.
Track demand data in recovering markets even if you don’t operate in them
In times of chaos and new situations, data scientists look to precedents and horizontal trends to construct new models or update their existing ones.
The novel coronavirus is different from every pandemic we’ve weathered before. As a data scientist and lover of history, I believe it is like a third world war that we’re all fighting together this time against an invisible enemy. It is very unusual because other recent pandemics such as Ebola, SARS, Middle Eastern Respiratory Syndrome were not as widespread. The Spanish Flu may have been similar in Europe and the USA, but we don’t have data from then.
Therefore, the most valuable source of insight for the recovery rate in your key markets from the COVID-19 pandemic will be tracking how demand returns in economies that are further along in their recovery journey, such as China, South Korea and Singapore. There are of course many variables, but as more countries recover, we will begin to gather insights into what revised baselines should be.
Key inputs for identifying your business’s recovery rate
The COVID-19 recovery rate needs to be understood as a temporally dynamic changing feature. Data scientists will need to build this feature by learning from the national economies that appear to be recovering earlier than others such as China and South Korea.
You will need to shift your expectations about the frequency of demand forecasting model iteration. The post-COVID-19 era will require a much higher frequency of updates and reviews of your models compared to normal demand forecasting models. Its requirements are likely to be closer in frequency to stock trading than set-and-forget demand forecasting algorithms from more productive and stable times.
Industry-specific rebounds will be essential data sources because the scale and velocity of impacts of COVID-19 on different industries has been shown to vary considerably. We can assume that the recovery rates will be similarly different as well.
My team will be doing this work at scale as we will be updating our ranking algorithms to reflect the impact of the COVID-19 recovery. PredictHQ aggregates and verifies millions of events worldwide, and then ranks them by impact. We are already building models to ensure our ranking is accurate as the world recovers.
For example, an event scheduled in October that would have been ranked as 100 on our log-scaled impact of 0 to 100 in 2019 may this year be at 70 or 80. Including the coronavirus recovery impact into our rankings is essential, as many global companies rely on our events to refine their demand forecasts.
Update your baselines and identify your demand catalysts
Once you have an updated baseline for the first few weeks and months of the COVID-19 recovery, you will be able to re-engage with suppliers as well as re-hire or train staff to meet that demand.
I want to focus now on including events into your demand forecasting, as they are both indicators of demand you can prepare for in advance, as well as catalysts for demand. Optimizing for these is even more important when demand is low, and businesses have weathered months of dwindling revenue. If you have not attempted to include events in your forecasting, we recently published this guide for data scientists on how to do so.
Once events begin to be rescheduled as well as new events planned, PredictHQ will publish weekly updates about the rate of event rescheduling, some of the key new events in major cities as well as insight on how to make the most of these events. You can sign up for these updates here, regardless of whether you are a PredictHQ customer or not.
You need to be able to focus your efforts on the surges of demand that occur. Events drive these so tracking events from massive down to minor is key. Even the small events can cluster to create significant impact – we call these perfect storms of demand.
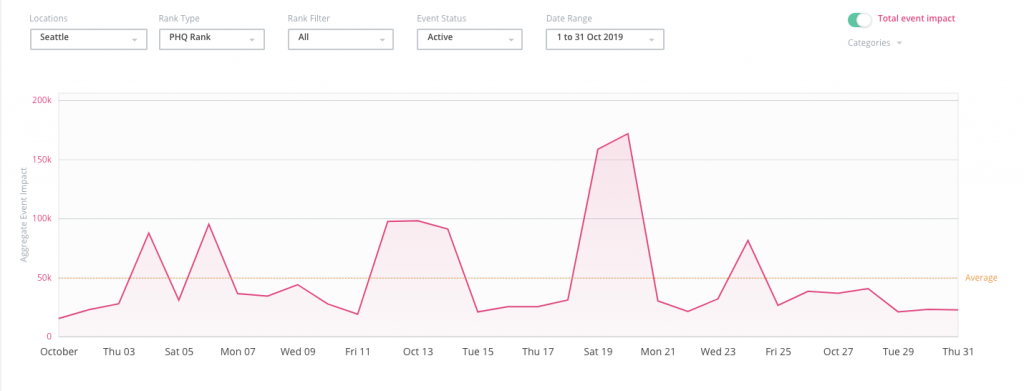
The easiest way to do understand event impact at a glance is with our Aggregate Event Impact tool. Once you have correlated your historical demand with events and learned which ones (categories and scale) impact your business, you will be able to quickly see the impact in each of your markets. For example, the graph below is aggregated impact of events in Seattle in October 2019. You can also search by specific lat-longs, such as for each of your stores, properties, depots or warehouses.
Identifying new dates for significant and major events postponed during COVID-19
With hundreds of thousands of events postponed worldwide, you will need a programmatic way to know when events are rescheduled. Because there are so many events, it is impossible to track these manually, and a waste of data science team time to be finding, verifying and standardizing this data when they could be building and iterating on models.
My team is currently finalizing a series of models to link postponed event records with their new dates, so you can focus on inputting this into your models so you can target them. A quick overview of these models:
Our systems already track and log when an event is postponed or cancelled almost instantly as we update the demand intelligence API every minute to ensure it is accurate.
Our Data Science team is building machine learning models with advanced NLP techniques to be able to automatically identify when new dates are announced for postponed events. This will also be near instantaneously, so our customers can begin preparing as swiftly as possible.
We are also building NLP models to create the auto-linkages between the event records that were postponed and the event records with new dates. Data scientists can use those linkages to forecast and track how much demand will shift, when and where.
Prepare for demand returning and more perfect storms of demand
This year and the coming recovery are probably the most dynamic time for events ever. Before the pandemic, thousands of high-impact events worldwide took place every week so they are impossible to track manually. This frequency of events will resume with time, but in the recovery the level of rescheduling and changes will make it particularly intense.


