Introducing Polygons: Accurately know area impacted by an event


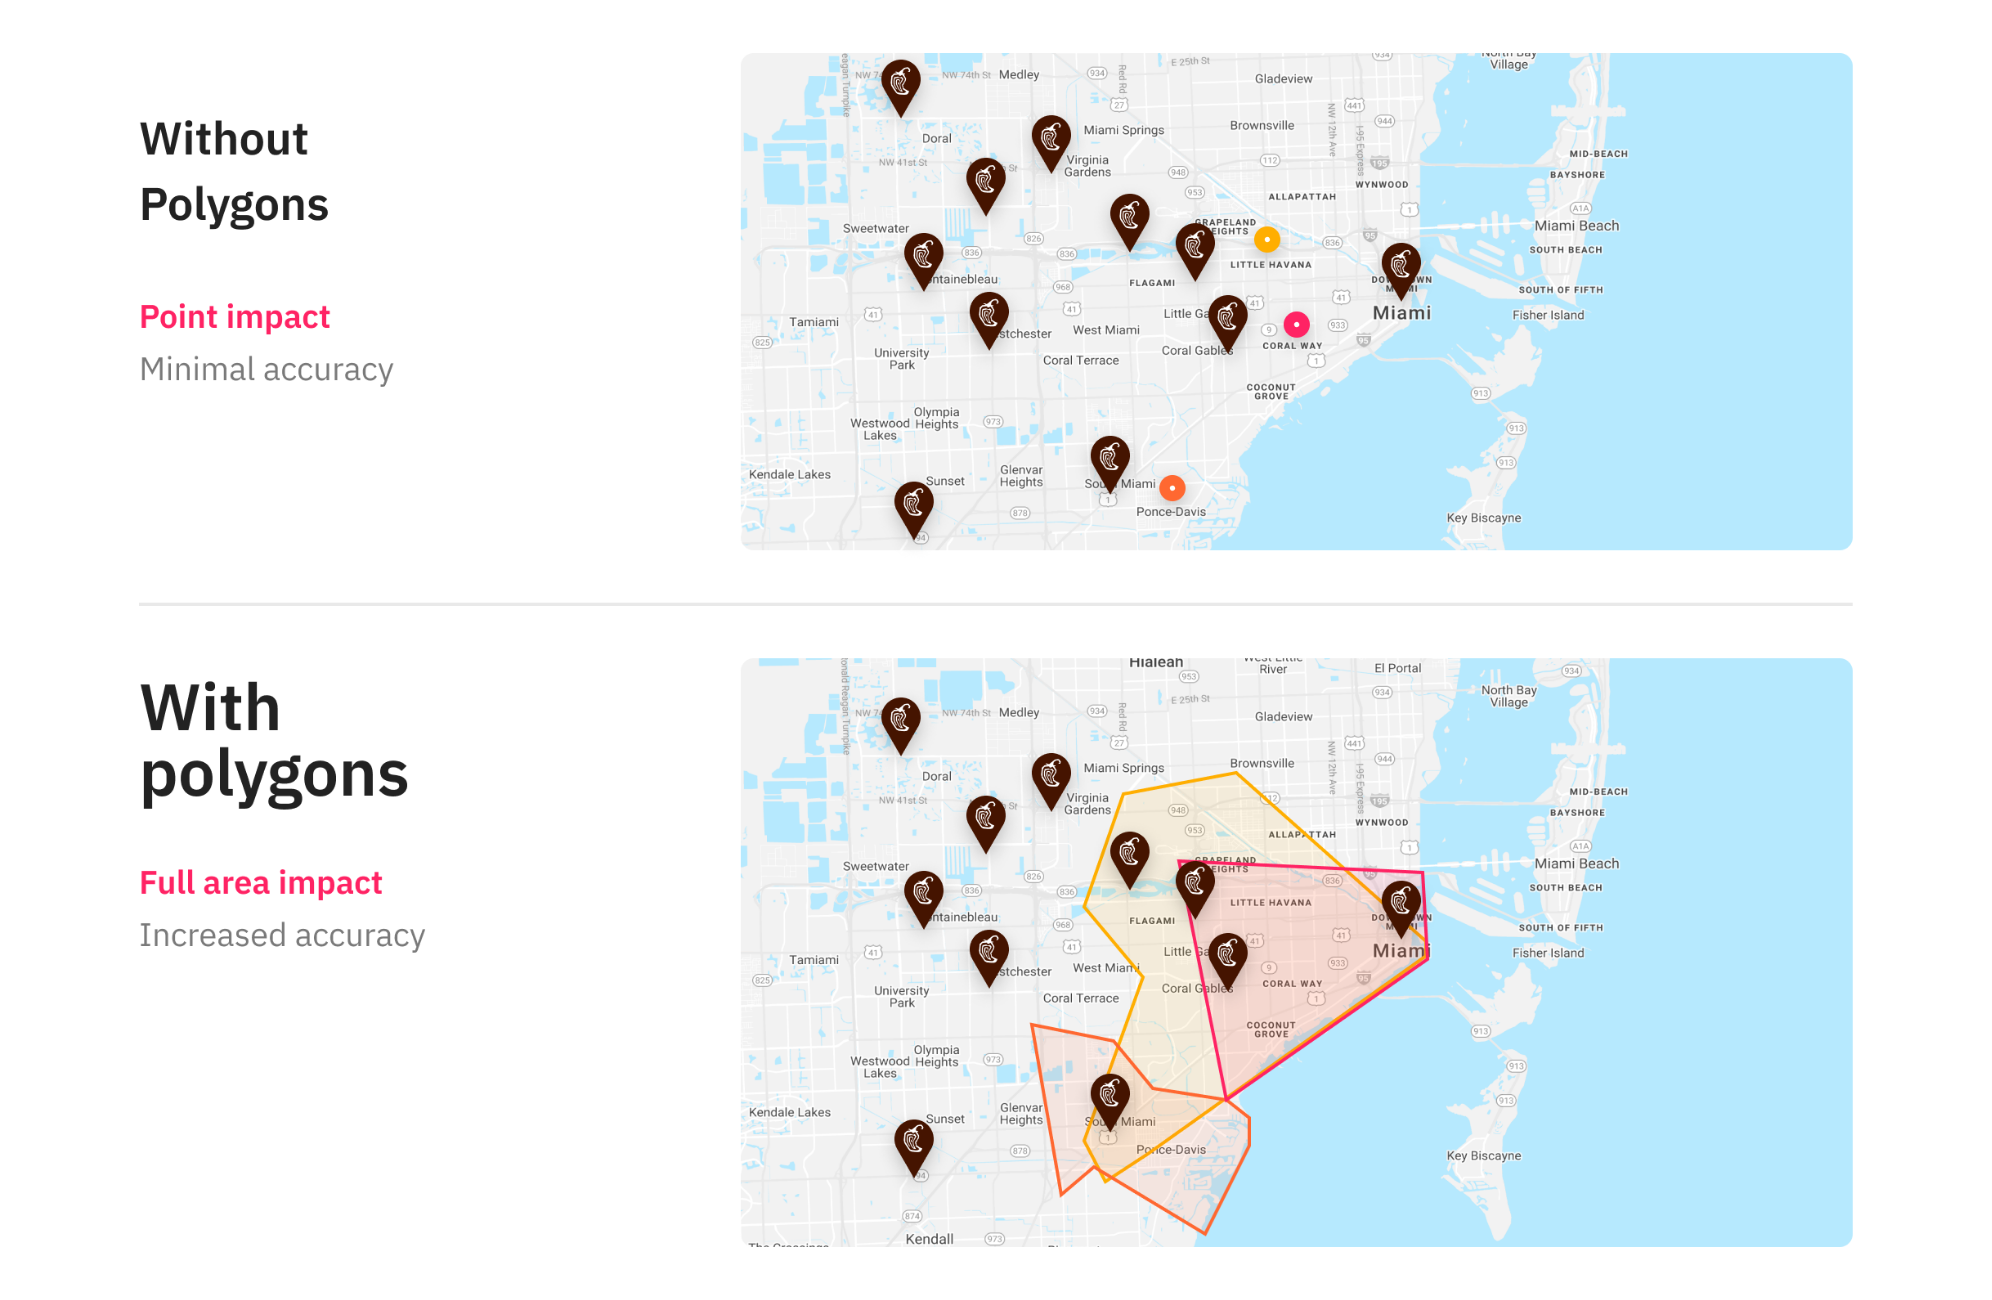
A sports game takes place at a venue - so it’s possible to pinpoint its location. You can then search for events happening within a radius around your stores or locations. If it falls close enough to your locations you will see the expected impact of the game. PredictHQ has built a series of models to identify, verify and enrich venues for every event - but what about events that take place across an area and not at a specific point on the map, such as marathons, school holidays or severe weather? We’ve just launched polygons to accurately capture the area impacted by these kinds of events.
The introduction of polygons makes our search functionality and our customers ability to know which locations will be impacted far more accurate. For example, rather than forcing models to assume that a hurricane heading towards Miami will impact all locations in the same way, polygons reflects the latest, most accurate information as to where it will and has impacted, and continually updates as the event evolves.
Polygons: know exactly where severe weather events are impacting
Our new polygons capability provides accurate details of the geographic area impacted by an event, represented as a shape on a map.
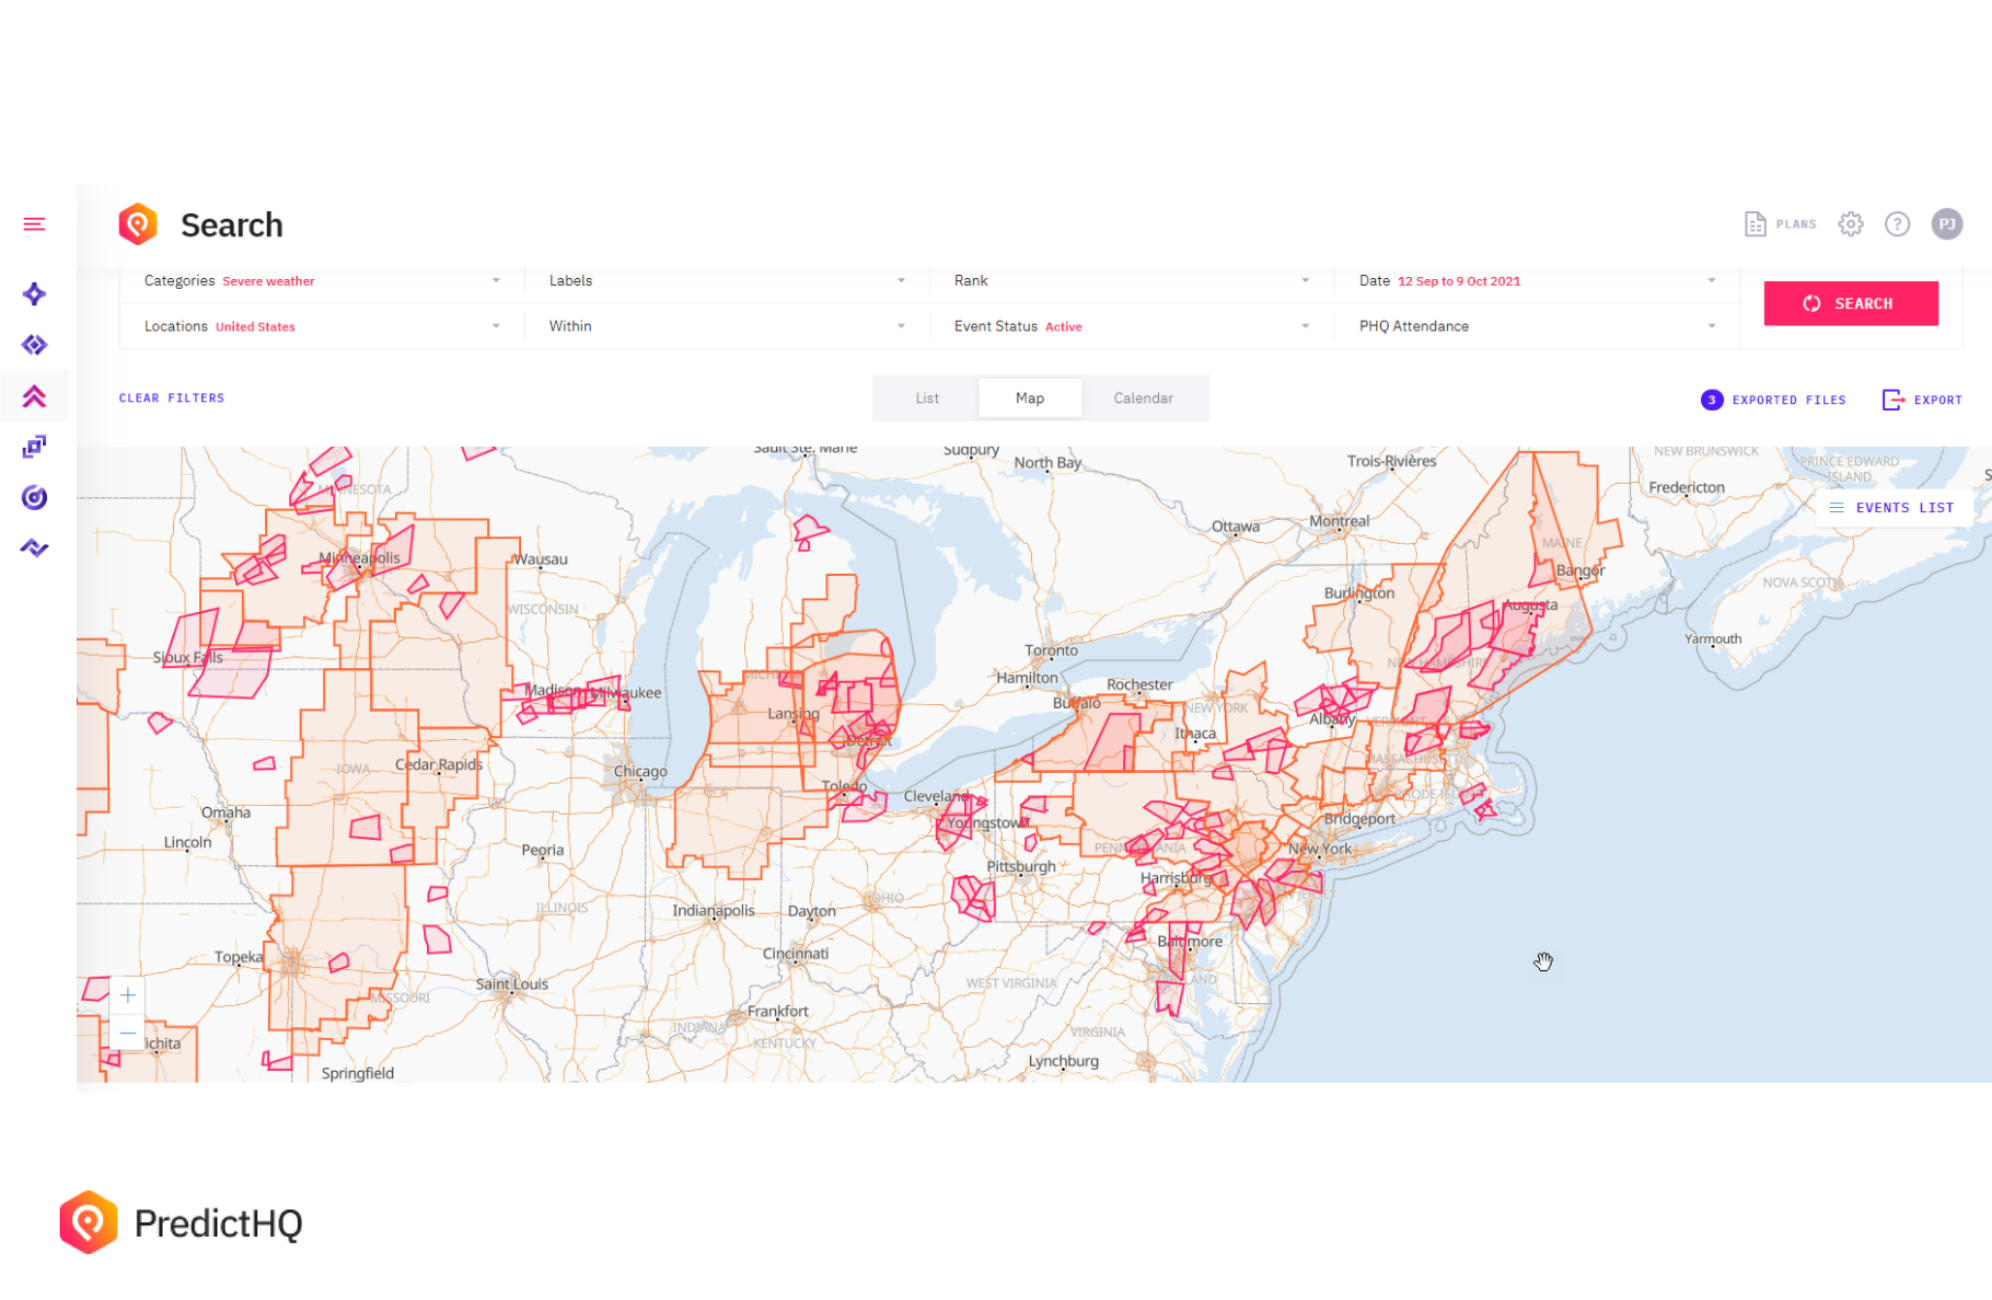
Easily search for areas impacted by an event using PredictHQ’s Control Center. When searching for events impacting a radius, all polygons that overlap that area are returned. The map view enables you to easily visualize all areas impacted near your locations to better understand which locations will have upcoming demand impacted.
Severe Weather could never be used to adapt your forecast. Until now.
As of mid October, all of our severe weather events in the USA are shown as polygons back to 2017. We will be expanding this out to other geographies and event categories throughout late 2021 and into 2022.
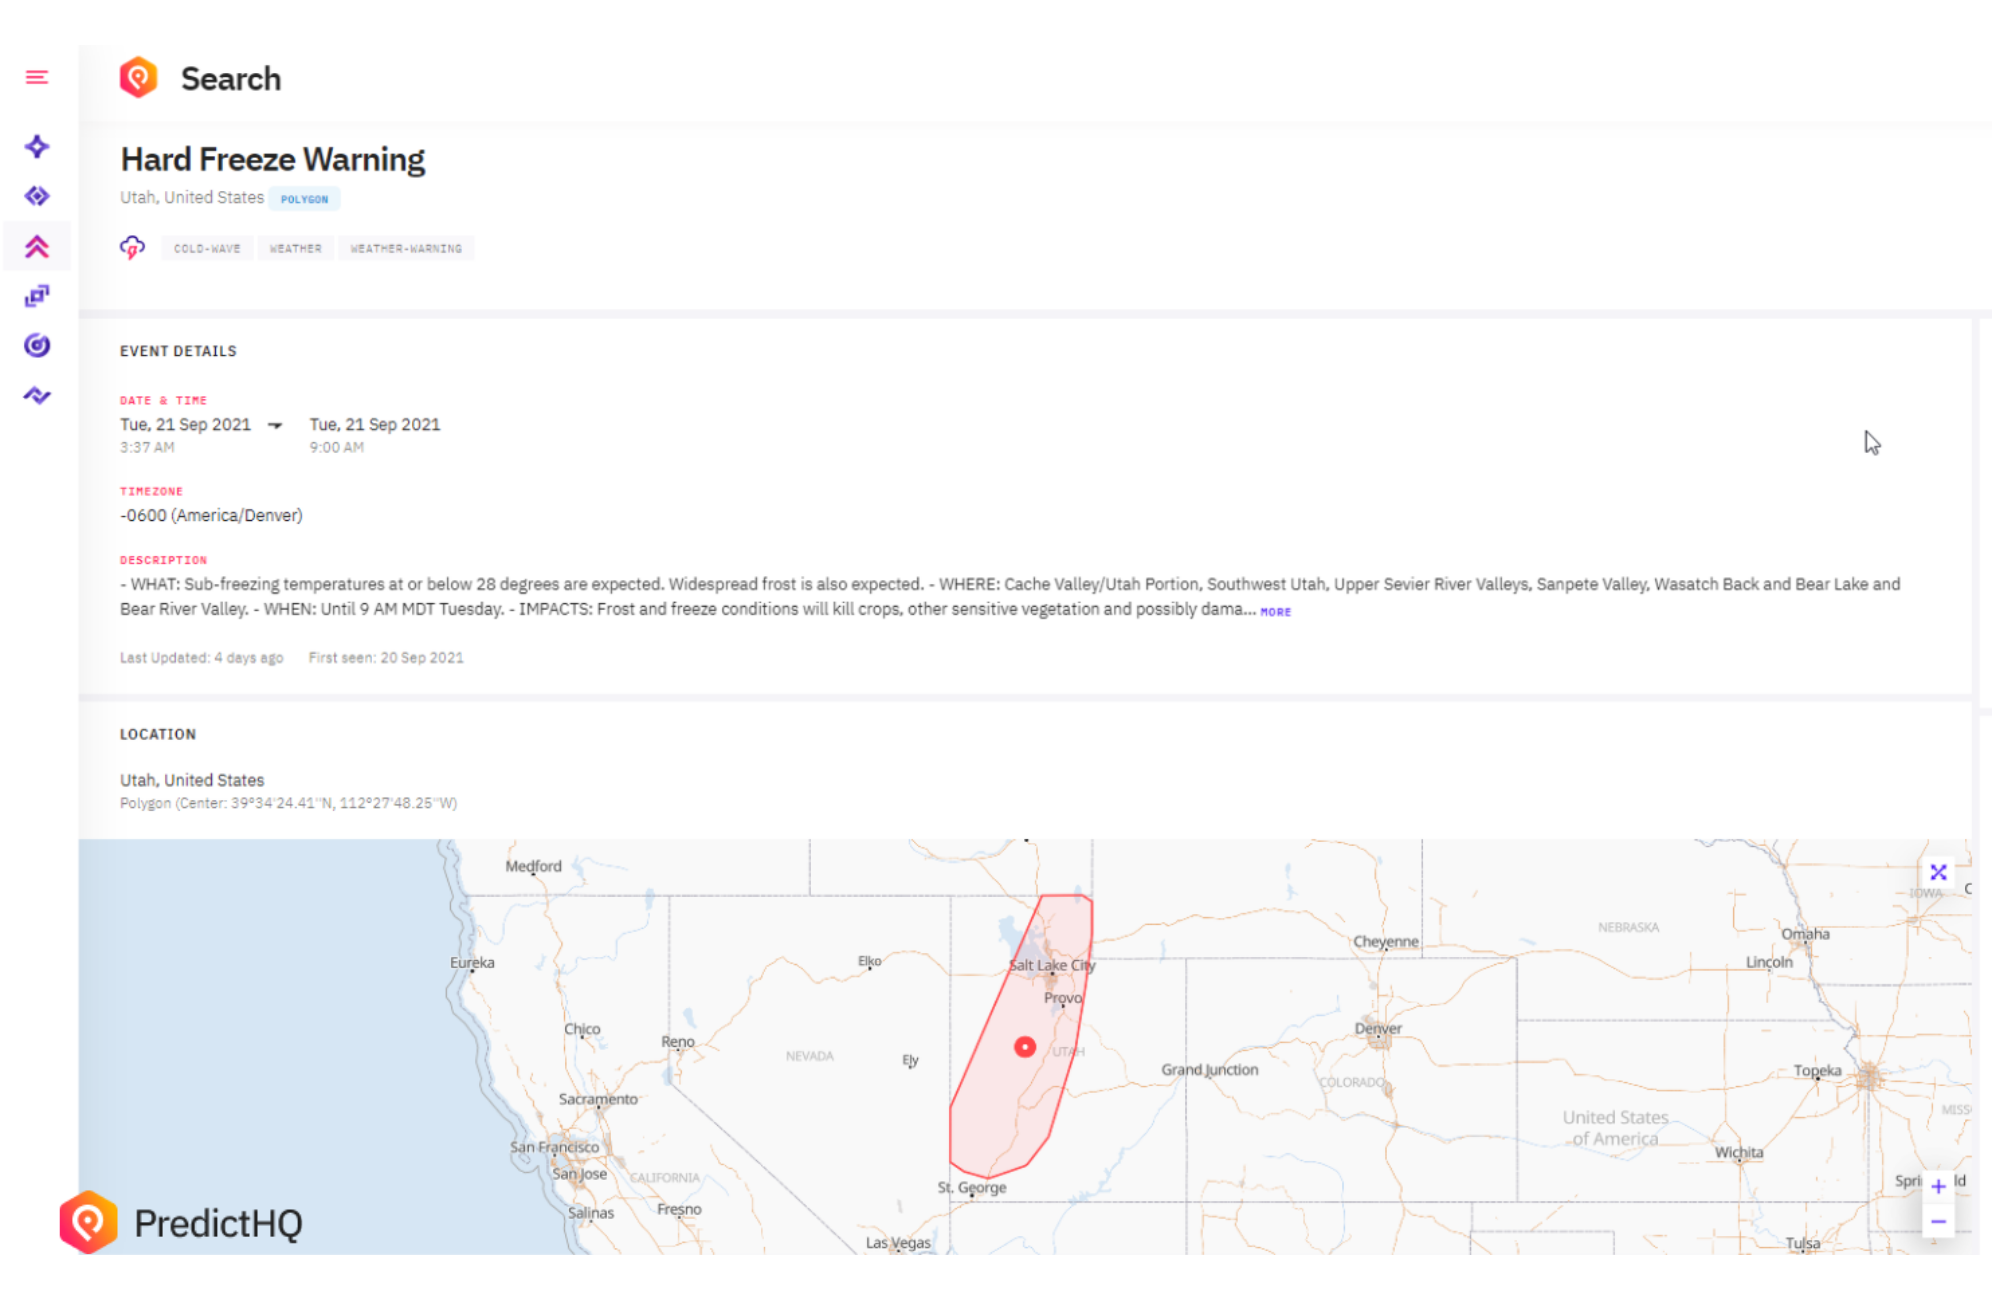
Below is a Hard Freeze Warning in Utah in September 2021. Polygons are important because without it, models could easily assume the whole state was experiencing a hard freeze, or only the cities they had thought to check. The introduction of polygons allows forecasting models to be far more accurate, so your models or teams can make the best decisions for every location. Whether that’s:
Reducing or re-allocating staff to locations that won’t be as impacted by the severe weather event
Redirecting inventory to minimize wastage
Running targeted marketing campaigns to help less affected stores outside of the event impact polygon make up the drop-off in orders within the affected stores
Diverting supply routes to ensure ongoing consistency of service
If you have a short-term forecast, let's say a two week forecast, you could make tweaks and adjustments to your models that will ultimately have an impact on decisions about labor and supply in real-time.
If you have a longer-term forecast, you can use historical severe weather events your models to understand patterns of impact. Polygons allow you to accurately determine which events are impacting a location. Then you can build features for your forecasting based on aggregating information across the events. See our severe weather data science guides for more information.
Polygons enables the ability to track historical severe weather patterns and to also understand things like cumulative impact of severe weather events, as it’s not uncommon to have several overlap, such as:
Severe cold, winter storms, hard freeze warnings etc
Or heatwaves, air pollutant warnings, severe heat warnings
We rank severe weather events by impact, so whether you are sourcing your demand intelligence though the API or via Control Center, your models and teams can prioritize the most impactful. For example, here is the north east USA for a several weeks in Fall in 2021:
Expanding our polygon coverage beyond severe weather
We also offer polygons for school holidays, which we now cover at the district level in the USA. Polygons are present for school holidays events for the USA and show the boundaries of the school district on a map. See the example below for the Nye County School District in Nevada. The polygons show the boundaries of the school districts. If you have a location within the polygon you know it will be affected by school holidays for that district. For locations outside the polygon they are outside the school district.


