Severe Weather could never be used to adapt your forecast. Until now.

Warnings or alerts about severe weather may lead to disruption and can have a huge influence on your business. Our severe weather category tracks things such as hurricanes, blizzards, floods, and more.

Recent Events

Top severe weather events that happened in the last 90 days

Thousands of severe weather events occur in the USA every month. These are a sample of the most severe weather events that happened in the last three months. Understand how severe weather impacted your business historically so that you can better forecast in the future.

Accuracy

Identify and track the geographic area impacted by severe weather events

Many events take place at a venue, with a neat point on a map. Severe weather events do not, nor do they impact states or even cities in a uniform way. PredictHQ's polygons enables enables you to see the full area impacted by an event represented as a shape. That means you will get a much more accurate picture of impact.

Track total impact

Identify the full extent of demand impact

Forecasting models need an indication of how long an event will have an impact, and how severe it will be on each impacted day. Our Demand Impact Patterns use complex machine learning models, learning from our massive historical severe weather data set as well as thousands of QSR and retail stores data. It identifies the impact on demand during the event, as well as the leading and lagging days and their impact. Without Demand Impact Pattern, a store would traditionally respond only on the day of the event, but they would have already over-forecasted for the two leading days.

Accuracy

Track severe weather events as they progress

Severe weather storm events can change over time. Events like hurricanes, tornados and other storms move across different locations and change in strength as time goes on. This can be reflected by different warning events in our system. It’s possible to have multiple warnings about the same weather condition. For example, maybe a flood advisory was issued at 11:48 AM in east Tennessee that the potential threat may last until 3:00 PM. Another flood advisory issued at 3:02 PM that indicates additional rainfall may occur on the day and the following day, and the road closures will remain in place. This enables you to have the most detailed information that you need to better understand demand.

Rank

Rule-based ranking to predict impact

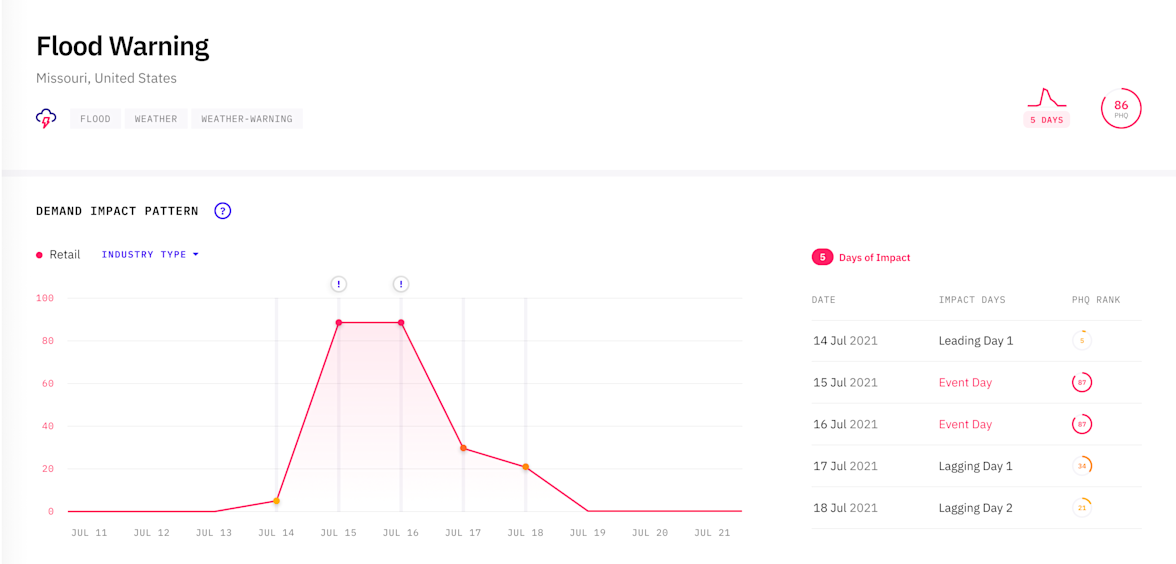
We’ve created a rule-based model to rank Severe Weather events. The PHQ Rank indicates the severity of the bad weather, with using the Common Alerting Protocol (CAP) data. CAP is an international non-proprietary digital message format for all-hazard emergency events. By using CAP there is consistency in how it is implemented in different countries, making it easier to use. CAP features evaluate the event from three aspects: urgency, severity and certainty. For example, An event with an urgency of immediate (15), a severity of severe (36), and a certainty of observed (35) would have a PHQ Rank of 86.

Instant Alerts

Be one of the first to know when Severe Weather is announced

Severe Weather can have swift, significant impact on demand. Knowing as soon as possible about relevant severe weather events gives your team the opportunity to respond accordingly. For example: A grocery store may increase staffing and stock in preparation for peak demand before a major weather event and then decrease staffing once the tornado, blizzard, etc arrives. You can set up alerts for key severe weather using our Notifications platform.

Demand Forecasting

Improve forecasting accuracy with historical data

No one was making severe weather consumable and explainable within demand forecasting, until PredictHQ. With the power of Demand Impact Patterns and Polygons, PredictHQs severe weather accurately reflects the impact of the event. Severe Weather can not be predicted far in advance, but having historical data on how these types of events have impacted business demand can help teams make faster and smarter decisions when warnings are announced.

You can’t prepare for what you don’t see coming

Harness the power of demand intelligence

Knowing the impact of demand causal factors like events will transform your business. The American Society of Hematology has a $45M estimated economic impact — and that's only one event in one city.

  • 0
    data points enriching
  • 0
    events across
  • 0
    cities, accessed via
    1 API