Predicted Event Spend: Technical Summary


Spending Categories
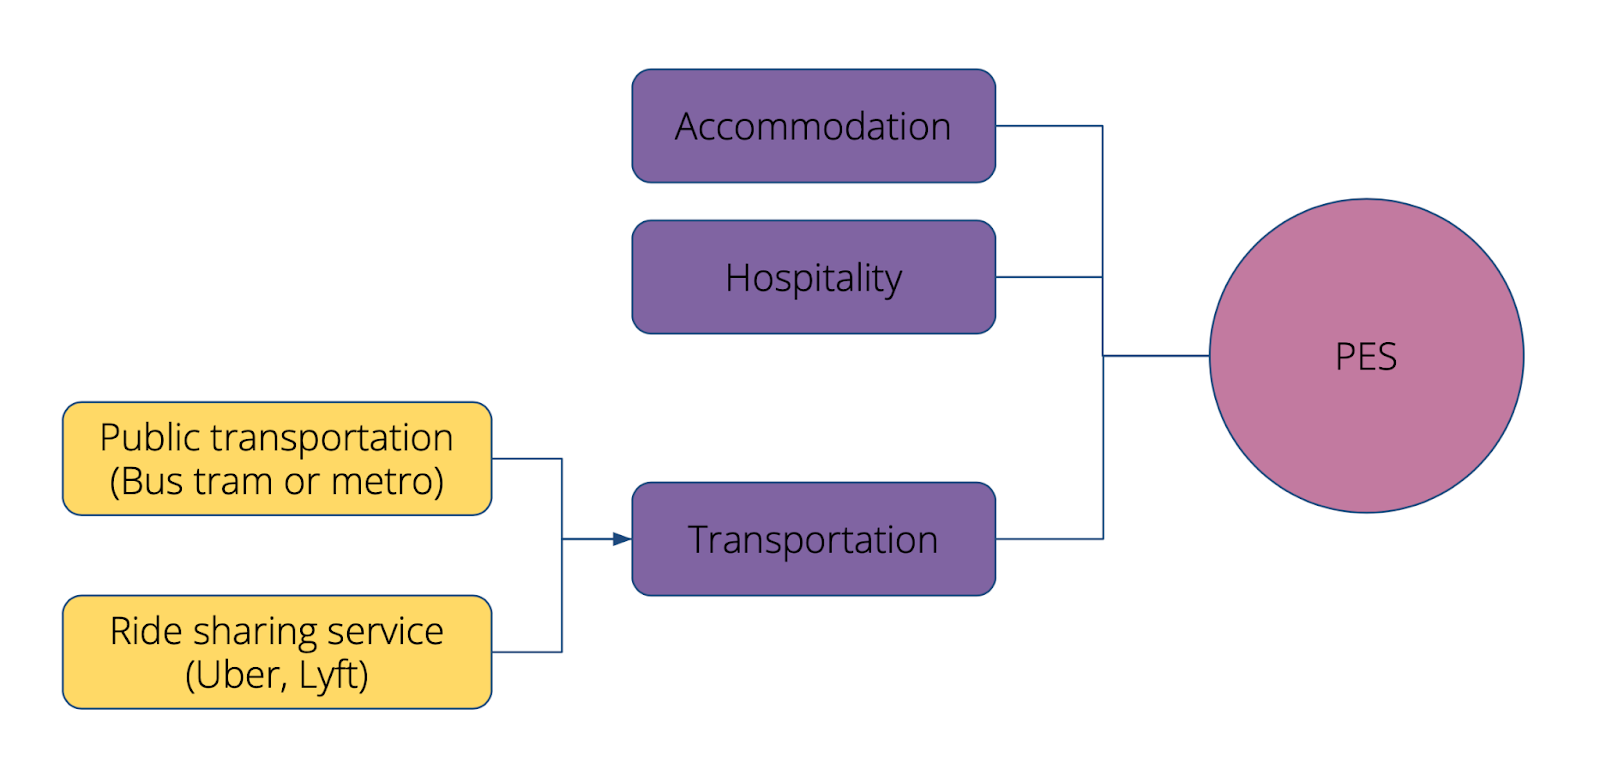
Scheduled, attendance-based events, or live events that require physical presence, are typically linked to economic impact experienced across different industries. This impact includes spending on meals and hotel bookings, among others on behalf of event attendees. Predicted Event Spend (PES) estimates the event-driven consumer spend impacting the following key industries:
Hospitality: This category encompasses spending on food and beverages. It is calculated based on the average cost of a meal in the event's location.
Transportation: This category covers spending on ground-based transportation, including public options such as buses and trains, as well as ride-sharing services like Uber and Lyft. This figure is determined using the average transportation cost in the event city.
Accommodation: This pertains to expenses related to hotel bookings for event attendees. It is calculated based on the average nightly room rate in the event city during the time of the event.
Methodology
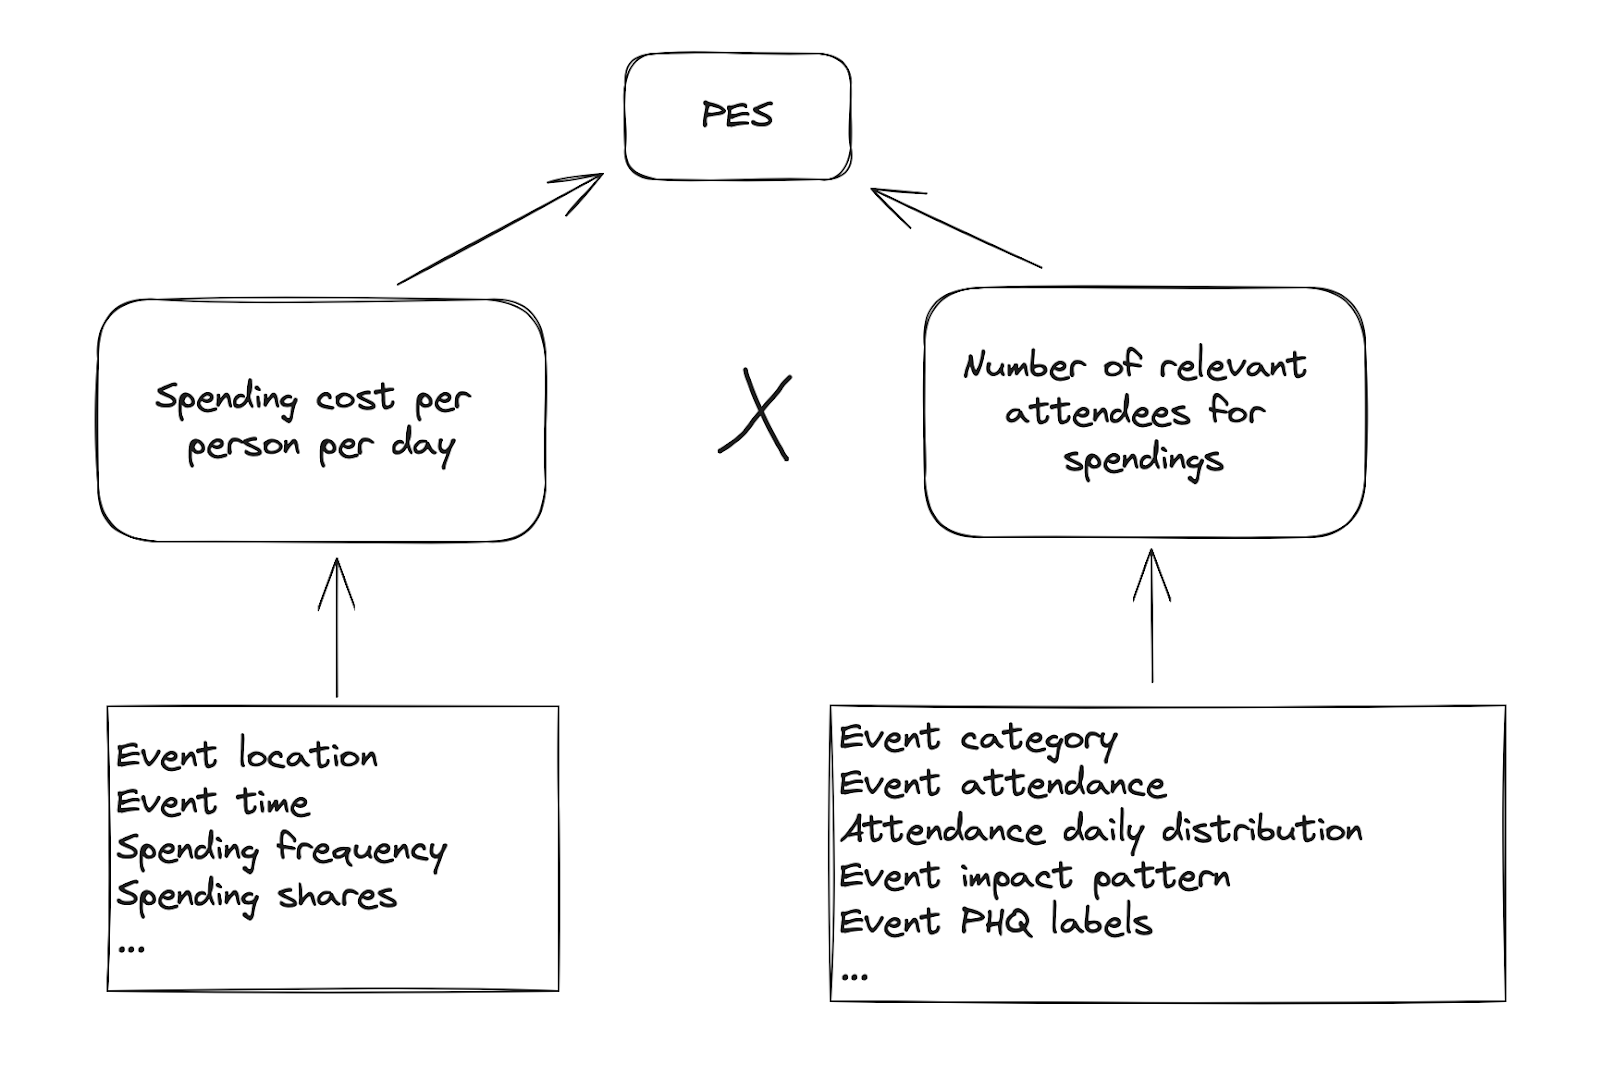
To estimate PES, two main components are considered:
The average spending cost per day per person, denoted as s.
The number of relevant attendees, denoted as n, who contribute to the corresponding expenditure.
Take, for instance, a concert with a total of 1000 attendees. If the majority of these attendees are from the local community, only a subset (e.g., 200) might be considered relevant for accommodation spending.
It's important to note that attendees might incur expenses on multiple days, encompassing both event days and non-event days. An example of non-event day spending would be accommodation costs incurred before the event begins.
The primary formula for estimating the PES of a specific event is:

Where ni represents the estimated number of relevant attendees incurring expenses on day i.
Average spending cost per day, per person
For a given event, the average spending cost per day per person is estimated based on factors such as:
Event location: Our spending costs dataset captures over 9,000 cities worldwide. For each city, we possess data such as average hotel room prices, one-way public transportation fees, and meal costs. These fees are timestamped, allowing us to reference specific time periods. For instance, the average hotel room price in San Francisco might be listed as $300 for December 2022. Therefore, with knowledge of the event's location, we can reference the relevant historical spending costs to estimate expenses for the event in question.
Event time: It's important to note that even if they occur in the same location, events might happen at times different from the timestamps when we have recorded spending costs. Therefore, we adjust spending costs based on the Consumer Price Index (CPI) and historical trends, taking into account the specific timing of the event.
Spending frequency: Attendees' expenditure can vary throughout the day. For instance, while attendees of multi-day business conferences might have three meals a day, concert-goers may only take one meal, typically near the event venue.
Spending share: In certain situations, expenses might be shared among attendees. Events that cater to families or groups, such as concerts, festivals, performing arts, sports, and community gatherings, often see costs distributed among participants. For instance, it's rare for every individual at such events to book separate hotel rooms. Thus, the average spending cost per day per person would typically be lower in these scenarios.
Number of relevant attendees for spendings
The number of attendees who incur expenses for accommodation, hospitality, and transportation can differ for each day of an event. The number of relevant attendees for spending on a given day, ni , is calculated as:

Where ri represents the estimated proportion of attendees incurring the specific expense, and Ni is the total number of attendees on that day. The estimation of relevant attendees who might have expenses is influenced by factors such as:
Event category: The proportion of relevant attendees is dependent on the event. For instance, an international conference may see a higher percentage of attendees requiring accommodation than a local craft fair. The type of event plays a crucial role in estimating the proportion of relevant attendees.
Event attendance: For events within the same category, larger events typically draw a higher proportion of out-of-town visitors, leading to an increased proportion of attendees with associated expenses.
Daily attendance distribution: For multi-day events, the distribution of attendance may be uneven across days. An event spanning both weekdays and weekends might observe variable attendance patterns. Typically, weekends draw higher attendee numbers because of increased availability, whereas weekdays might see fewer attendees, especially during regular working hours.
Event impact pattern: Spending related to an event can also occur outside the official event days. For example, attendees might book accommodations in advance of the event's commencement, resulting in pre-event day expenses.
Event PHQ labels: PHQ Labels highlight an event’s key themes. Using the PHQ labels, the model adjusts the estimated proportions of attendees with expenses, revealing patterns or themes that might influence attendee behavior. For instance, the model would assign a higher proportion of attendees to accommodation expenses for a "sports-and-gaming" conference event.
Other factors influence the estimates of both the average spending cost per person per day and the number of relevant attendees for spendings. Notably, information about entities linked to events, such as the performer or organization that is associated with the event, play a crucial role in these estimations. Events that feature popular performers, such as Taylor Swift, typically see increased spending per attendee and attract a larger number of relevant attendees for spendings.
Evaluation
Predicted Event Spend, with its wide-ranging applications, holds immense potential to enhance various aspects of business operations. Not only can it be used to streamline marketing and promotional strategies, but it can also be invaluable for tasks related to demand forecasting. To gauge the efficacy of PES, our primary metric of evaluation revolves around its utility in enhancing demand forecasting outcomes.
Forecasting comparison
For each demand dataset, we used the Suggested Radius API to determine the most relevant catchment area around the location of interest. The PES of these events was then aggregated on a daily basis and used as a feature for the forecasting task. On days when multiple events contributed to the PES, the total was represented by the sum of the PES from all events.
For each demand dataset, we generated two sets of forecasting results:
Forecasting without PES features: An XGBregressor was trained based on time-related features, such as day_of_week, week_of_year and month_of_year.
Forecasting with PES features: An XGBregressor was trained based on time-related features, such as day_of_week, week_of_year and month_of_year, and PES features.
Performance during the testing period was assessed using the mean absolute percentage error (MAPE). The absolute MAPE improvement refers to the difference between MAPE of baseline forecasting and MAPE of forecasting with PES. Results were as follows:
Accommodation:
Average MAPE (Baseline): 33.4%
Average MAPE (With PES): 31.7%
Absolute MAPE Improvement: 1.7%
Hospitality (Food & Beverage):
Average MAPE (Baseline): 22.47%
Average MAPE (With PES): 22.03%
Absolute MAPE Improvement: 0.44%
Retail:
Average MAPE (Baseline): 20.19%
Average MAPE (With PES): 19.97%
Absolute MAPE Improvement: 0.22%
From this comparative analysis, it's evident that incorporating PES enhances forecasting accuracy across all three verticals, with the accommodation sector seeing the most significant improvement.


