How restaurant chains can use high ROI data in continuous forecasting in 2021 and how one leading chain will save $8.5m with PredictHQ's data


Quick service restaurants had a tumultuous year in 2020. Most were quick to roll out massive changes to their point of sale and delivery strategies as they grappled with COVID-19, while re-organizing their labor management and inventory coordination strategies. In 2021, some of the behavioral shifts are likely to continue – but as the vaccine rolls out, restrictions ease and confidence picks up, foot traffic and events will come back rapidly. This will lead to the return of in-store demand and with it, the demand anomalies that are hard to predict and prepare for without the right external data.
BTIG analyst George Saheh highlighted QSR Magazine that the way some states had reopened and others hadn’t has “set up an uneven recovery for the coming year as those lagging geographies will see a outsized comeback, reversing regional dynamics of the past nine months.”
With a fragmented recovery ahead of us, most companies are seeking out new inputs to demand forecasting. If we’ve learned anything from 2020, it is a lot can change very quickly. Neither 2019 nor 2020’s data is enough on its own to forecast demand accurately this year, and a weekly or biweekly rolling average will miss upcoming event-driven surges in demand. That’s why many quick service restaurants are doubling down on continuous forecasting models, fueled by external high quality data sources.
The right external data will make your core processes smarter: forecasting, pricing and labor optimization
The inclusion of external data is critical. McKinsey’s Chief Data Officer Mohammed Aaser puts it this way: “The COVID-19 crisis provides an example of just how relevant external data can be. In a few short months, consumer purchasing habits, activities, and digital behavior changed dramatically, making pre existing consumer research, forecasts, and predictive models obsolete. Moreover, as organizations scrambled to understand these changing patterns, they discovered little of use in their internal data. Meanwhile, a wealth of external data could—and still can—help organizations plan and respond at a granular level.”
Investing in new data brings challenges – especially when many companies are running with fewer staff than pre-pandemic times. PredictHQ works with some of the USA’s largest quick service and fast casual restaurants and we want to make it as easy as possible for your team to expedite getting your hands onto data to get your demand forecasting 2021-ready. Below is a high-level summary version of the first step of our impact quantification process. A similar process will work for many other data sources that inform what drives demand so machine learning models can create more accurate forecasts.
The PredictHQ team goes through this process for every customer. Once we have identified the impact of our data on their demand forecasting accuracy, our value quantification team assists to model out what this improvement means for their bottom line. One leading fast casual customer we work with has more than 5,000 stores and is using our data to tap into a projected $8.5 million in labor optimization and supply chain efficiencies in a year.
There are many challenges to running a major food company, but a fundamental piece is minimizing under-forecasting and over-forecasting. Unfortunately, this is difficult as there are so many factors driving demand for stores. Foot fall predictions need to factor in time of week, time of day, weather, events, pay cycles as well as disruptions around stores, such as pandemic lockdowns, protests and traffic issues. These days, most food chains are offering a substantial quantity of delivered meals also, either directly through their driver network or through delivery apps such as DoorDash or UberEats. Getting hot and tasty orders to customers in a timely way can be affected by many similar factors to footfall, but you also need to factor in key televised sports games or online events such as the launch of new streaming shows that can spike orders as well.
Below is a generic example of our data impact process to share the high level process with you. There is substantially more to the process, which is tailored to each customer’s situation and business priorities. We have made a series of industry assumptions to arrive at the input figures.
For the analysis below, we have assumed PredictHQ’s data leads to a 1% error reduction based on the results of our error reduction identification process that we normally go through with customers.
Data inputs
Errors in demand forecasting cost millions every year. Over-forecasting results in inventory going to waste and high disposal costs, in addition to increased labor costs with surplus of staff in store. Under-forecasting can lead to lines snaking out the door, exploding wait times and customers met with a disappointing “sorry we’re out of stock, costing both sales and customer loyalty.
For this example, let’s use a quick service retail chain with $4B in annual sales and 2,000 restaurants across the United States. Their demand forecasting is done on a rolling average of 14 days and their forecast drives downstream decisions around labor scheduling and supply chain management. In some states they need to have staffing schedules locked-in a week in advance, and ingredients and packaging inventory are coordinated from HQ – so any improvements to forecasting weeks in advance can have a major impact.
Here are some inputs to calculate the impact of forecast error:
| Input | Value |
|---|---|
| Food costs (% of sales) | 33% |
| Avg % of over-forecasting becoming waste | 13% |
| Avg % cost of disposing food/ingredients | 15% |
| Storage costs of excess food/supplies (% of sales) | 5% |
| Labor costs (% of sales) | 30% |
| Avg % of over-forecast becomes increased labor cost | 12% |
The above are fairly standard assumptions for modelling out errors. But applying the 1% of error reduction mentioned above, here is the impact:
| Input | Value |
|---|---|
| Total cost of wasted food | $858,000 |
| Total cost of disposing wasted food | $128,700 |
| Total storage cost of excess food/supplies | $287,100 |
| Total Labor Costs | $720,000 |
| Total Benefits | $1,993,800 |
The impact of under-forecasting sales
Over-forecasting is one challenge, but the solution isn't permanent under-forecasting, which is costly and threatens customer experience and loyalty.
| Input | Value |
|---|---|
| Input | Value |
| Avg loss of sales (%, due to under-forecasting) | 10% |
| Profit margin | 32% |
| Food costs (% of sales) | 33% |
| Avg increase in procurement costs (%) | 10% |
| Shipment costs (as a % of sales) | 5% |
| Avg increase in shipment costs (%) | 12% |
Also applying the 1% of error reduction mentioned above, here is the impact when you use data to drive down under-forecasting:
| Input | Value |
|---|---|
| Costs avoided | Value |
| Potential profit loss from lost sales | $640,000 |
| Increase in procurement costs | $660,000 |
| Increase in shipping costs | $115,000 |
| Total Benefits | $1,415,000 |
Assuming an even distribution (50/50) between over- and under-forecasting scenarios, the numbers above show that a 1% in error reduction can yield $3.4M in benefits per year for this particular example.
With PredictHQ demand impact data, QSR chains have the ability to take a much more proactive approach to inventory management and staffing, driving greater profitability. This is because PredictHQ’s data is a unique lever to contextualize the impact of events, both pre-COVID (what used to drive your demand), during COVID to track things like shelter-in-place and lockdowns, and post-COVID as events begin to return, which will drive your demand. This is a particularly powerful insight for QSR companies, where stores can differ so distinctly. Just because large, attended events haven’t returned at scale yet in say San Francisco, Boston and New York where your demand planners might be based, doesn’t mean there isn’t a lot of activity going on in other states such as Florida, Nevada, Texas, and others (as well as unscheduled events, non-attendance based events and TV events in every state). Knowing which events will impact which stores allows you the precision you need in this time of tight margins.
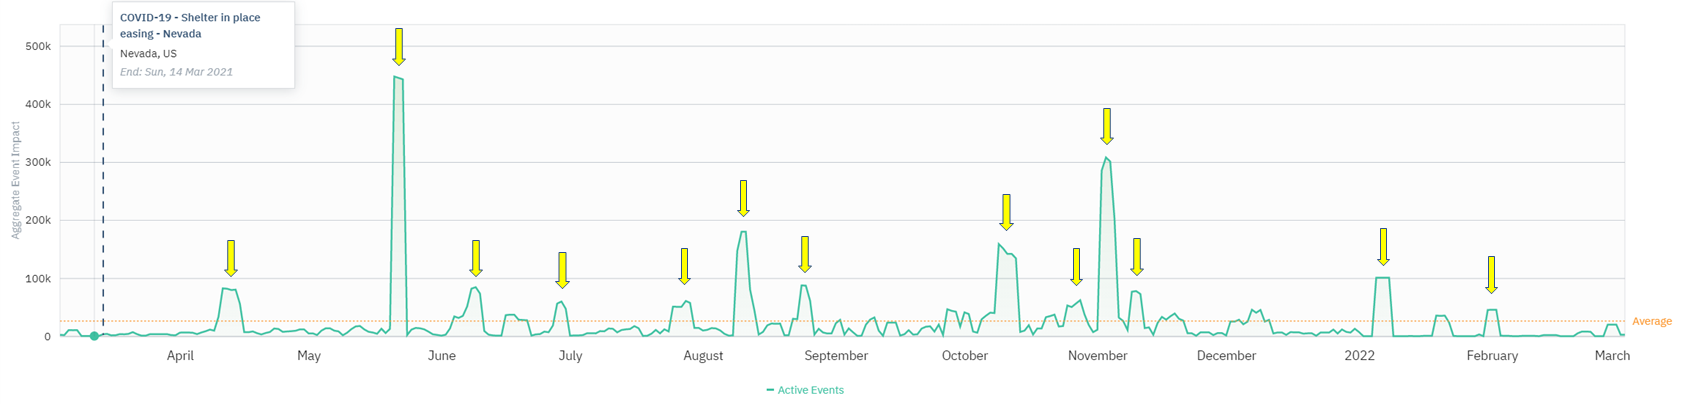
Let’s explore a particular city where events are starting to come back. The city of Las Vegas seems like a good place to look as it is lifting its shelter-in-place order by March 14th of this year. Our Aggregate Event Impact data shows high impact days where events are driving tens of thousands of people into an area. Similarly, our data also shows low impact days driven by either a lack of events or events that cause decremental demand. Our data shows that for the next twelve months for the city of Las Vegas there are approximately 46 days in which there will be anywhere between 50,000-450,000 people attending a major event which drives demand for restaurants nearby. The graph below shows when the city will experience high demand over 2021. Please keep in mind events are only just beginning to be scheduled as the vaccine rolls out, so the volume of events will increase as the year continues.
Case study: $8.5 million a year saved through investing in demand impact data
One of our customers is a leading QSR chains in the USA and mapped out multi-million dollar projects across multiple use cases, arriving at a projected saving of $8.5 million.
Whether it’s a sports match, a school holiday, severe weather, a major conference, or a college graduation, events cause millions of people to make purchasing decisions every week. While the impact of scheduled attended events such as conferences and sports can feel remote during the pandemic, many countries are beginning to ease restrictions and mass event bans over the coming months. Being ready for these events to return and making the most of the thousands of ongoing events such academic events and observances will ensure you can meet demand while running a lean team.
Find out more about how they did it here.
Invest in intelligence to enables your models and teams to make better decisions at scale
The pandemic year was brutally hard. And the recovery year is going to be challenging as well, but we can all see the light at the end of the tunnel. At PredictHQ, we can see that light clearer than most, because we can see the large demand-driving events that are already being scheduled throughout 2021, like the Las Vegas example.
Our customers have access to every event that is being scheduled this year, and in many cases, rescheduled events that were postponed last year. The calendar of large events looks different this year, which is also likely to be one of the most chaotic and fragmented, with each state, city and store responding at different times and with different recovery rates.
Reach out to our team to find out which events impact your demand, how you can track them and take advantage of our quantification teams to understand how this investment will enable your teams to chart the best course through this coming hopeful and chaotic year of economic recovery.


