We’re predicting 2022 will be the most watched Super Bowl ever: Here’s why

You may have seen our CEO in CNBC news this week, speaking about how our Live TV Viewership model has predicted 117 million people will tune in to watch the 2022 Super Bowl this weekend. This would be a record Super Bowl viewership, so if you’re not a PredictHQ customer, you probably have some questions. Welcome!
In this post, I’m going to explore:
How we calculate predicted viewership for live televised sports in advance
Why the PredictHQ Live TV Viewership model is predicting a record high viewership for the 2022 Super Bowl
How we know our predictions are accurate
How we arrived at out prediction of a surprisingly low Super Bowl viewership in 2021, which turned out to be 99.6% accurate
What QSRs, delivery, on-demand and food retail customers are doing with this advance insight into sports viewership
How PredictHQ calculates Live TV Viewership in advance
The short answer is: we have built a series of models that can accurately predict the viewership for key live sports codes televised across the USA. We built the original model in 2020, when some of the only events that continued during the pandemic were sports games without fans that were televised.
We explain how the model works in detail here, but to summarize: our model uses more than 20 distinct features to pinpoint the expected viewership of a game. These include viewership trends per season, the uncertainty of the match up and the popularity of teams playing.
For the Super Bowl, there are other factors such as game day; the time and stage of game; and competing sports broadcasts on the same day (which are less relevant but can be highly impactful for other NFL and sports live viewership, which we track throughout the season).
Our Live TV Events are the only source of predicted viewership, and the only viewership data available at the county level. Both the foresight and county granularity is required for how our customers use this data, also known as demand intelligence, which is used by quick service restaurants, food delivery, on-demand and grocery stores to stock up in advance of game-day demand.
Why the PredictHQ Live TV Viewership model is predicting a record high viewership for the 2022 Super Bowl
This year’s Super Bowl match is an interesting one and our predictions are landing at 117 million, possibly down to 110 million.
The uncertainty of the match is relatively low, with the LA Rams expected to beat the Cincinnati Bengals, and neither team being among the top 15 most popular NFL teams. Both high uncertainty and highly popular teams have been shown by our model to draw far higher viewership. Interestingly, the unexpected performance of both teams is potentially driving more interest.
However the major attributable difference contributing to the predicted record viewership this year is an elevated interest in the NFL, which has been enjoying up to 41% more viewers for televised games than last year.
How does PredictHQ know the predictions are accurate?
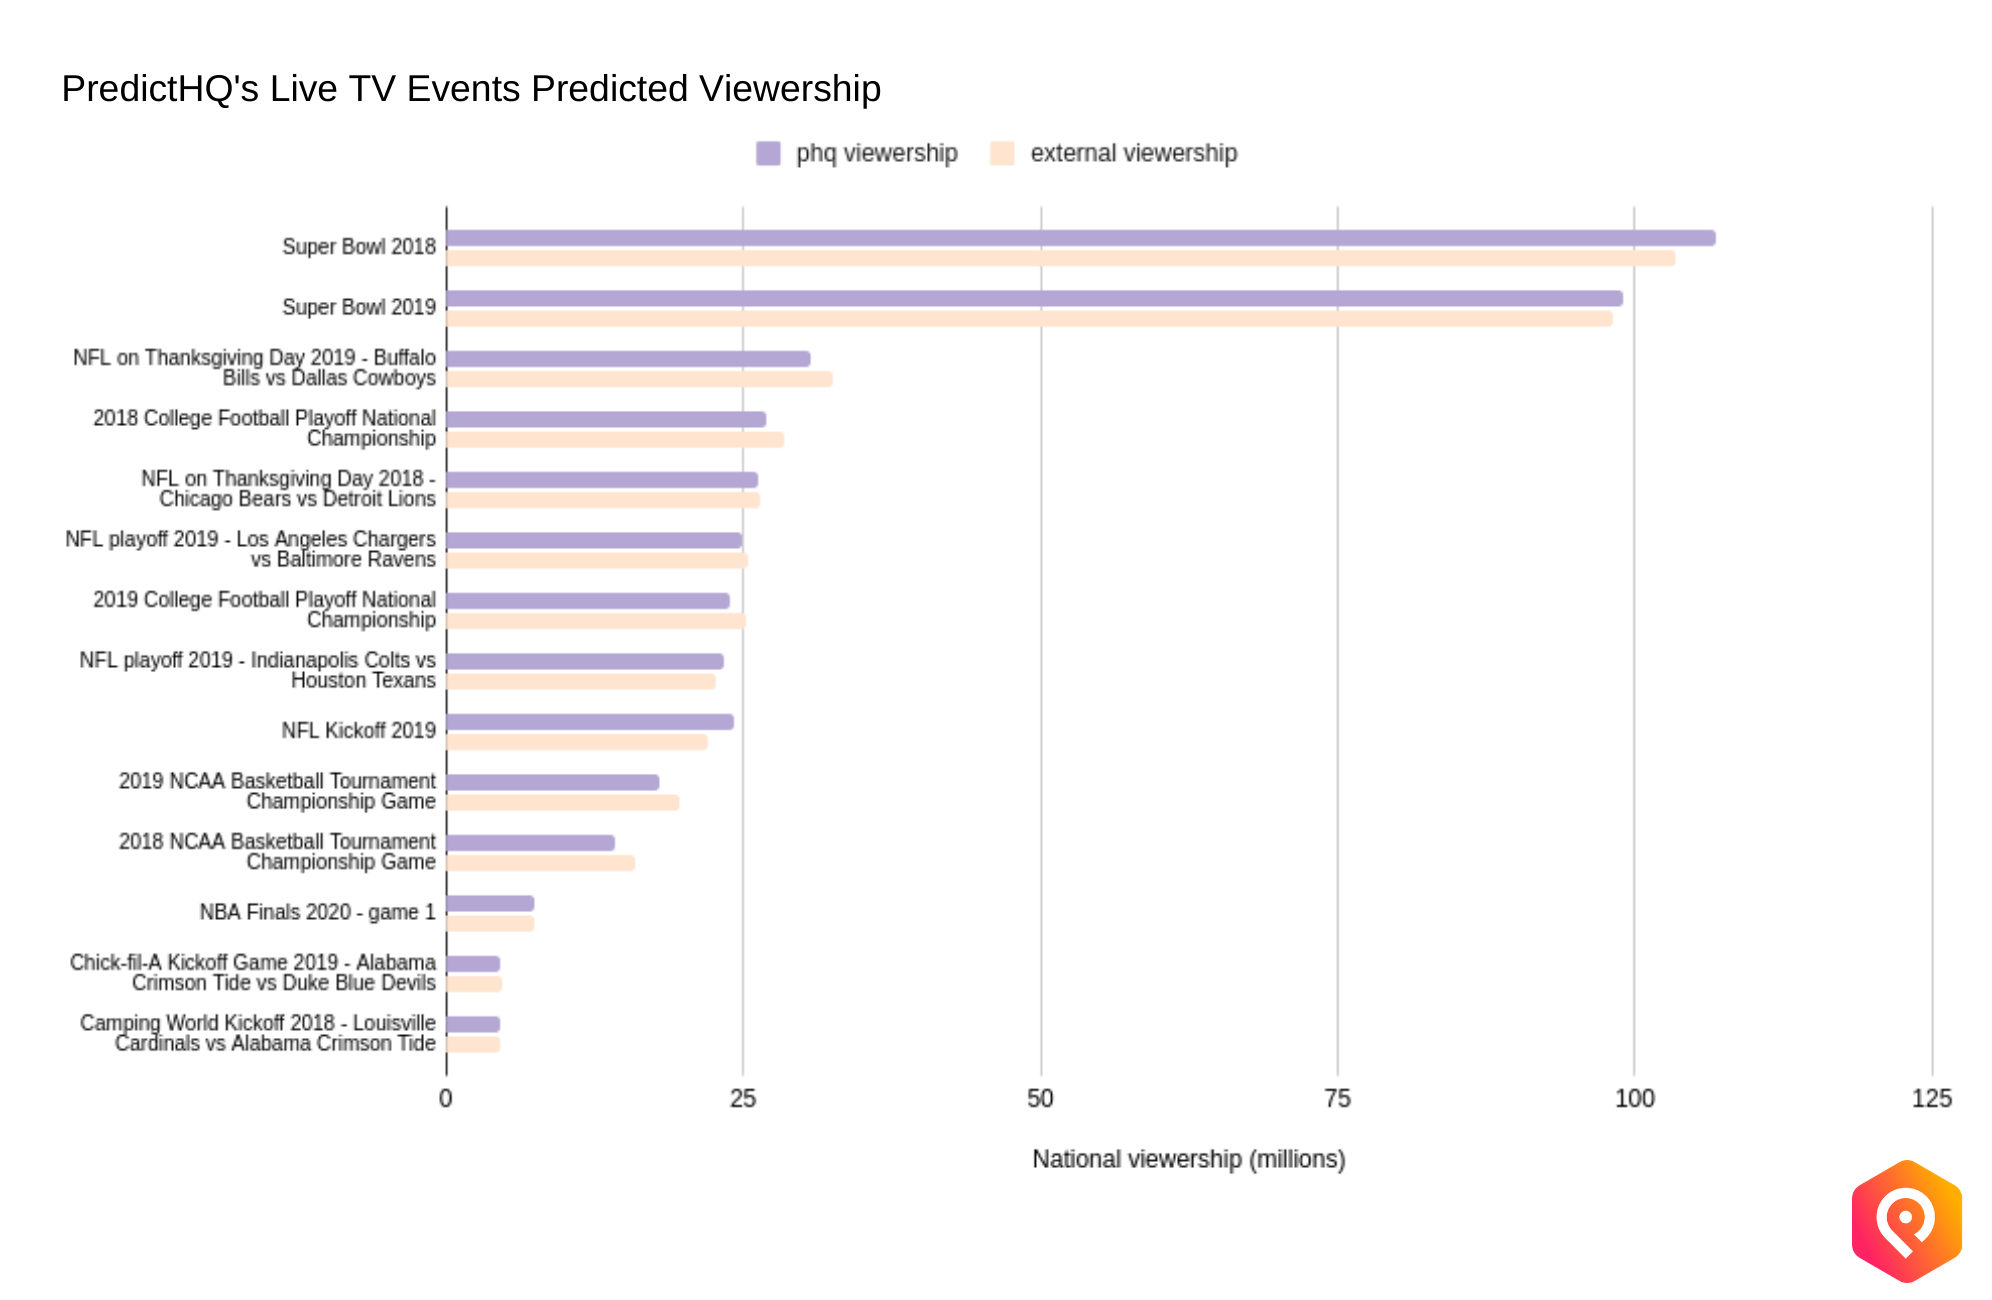
This is the million dollar question for every prediction, so we wanted to address this first thing. The image at the top of this post shows how our predictions stack up against post-game data from other providers.
We look at two main factors:
At the aggregated national level, our predicted viewership for games that have already occurred is within a close margin of historical viewership by post-broadcast estimation models. As you can see from the graph below, our predictions are similar to external post-game sources such as NBC’s post-game viewership data.
As we built the model, we also tracked if our viewership figures correlated with the expected impact on demand for our key customers.

Tracking both elements is critical to creating forecast-grade data. Accurate predictions that don’t relate to customer transactional data would indicate that we weren’t identifying relevant information for smarter demand forecasting, which is what our demand intelligence is all about.
In this post you can see a table of comparisons between our predictions and post-game viewership from other providers. But we also want to explain how we accurately predicted the surprisingly low viewership for 2021’s Super Bowl (well, surprising for everyone but us and our customers).
Our most recent NFL viewership predictions continue to be accurate and well within the confidence interval
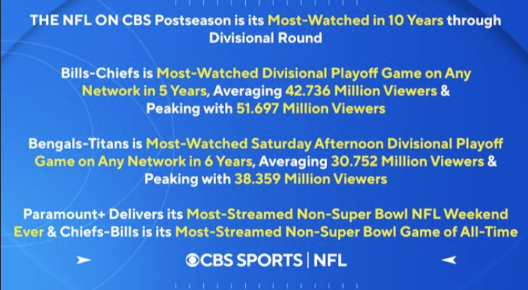
Each sports season is different, and that’s especially true in the pandemic era. Our predictions for the last two NFL games are well within the confidence interval and our margin of error of 15% when compared to CBS’s post game viewership.
Our predictions were:
Broadcast Viewership for the Buffalo Bills vs the Kansas City Chiefs with a predicted total viewership of 46,562,484
Broadcast Viewership - Cincinnati Bengals vs the Tennessee Titans with a predicted total viewership of 41,184,377
While not identical to CBS’s viewership (see the visual from their Twitter below), they are well within the range of viewership throughout the game, as well as confidence interval and therefore fairly accurate.

How we accurately predicted surprisingly low viewership for the 2021 Super Bowl
Two weeks out from the 2021 Super Bowl, our model delivered a surprising forecast — the lowest Super Bowl viewership in 20 years. It produced a forecast of 96 million viewers, down 6 million from 2020’s and the lowest since 1997. The post-game viewership from CNBC was 96.9 million — so our (at the time very new) model was doing well!
Data scientists are frequently asked to explain their forecasts. We explored the reasons in this post, but in brief, we were able to identify that it was largely due to three factors:
Sports fan prediction: Sports viewership was lower in 2021 due to a drop in the NFL’s popularity. Like most sports, it attracted fewer viewers in 2020. Our model considers several factors including historical trends and monitoring shifts in league popularity.
Super Bowl playing team rankings: Due to the popularity of the two teams that made it into the finals, as reflected by their regular season ranking, our model predicted slightly lower viewership than last year. This is because while the Kansas City Chiefs are the most popular team this year, they were playing the Tampa Bay Buccaneers, which is the 10th most popular team. Last year, the Chiefs were playing the San Francisco 49ers, which were the third most popular team. Popularity has a heavy influence on the number of viewers tuning in.
Game uncertainty: This is one of the most interesting features of our model — it calculates how much the uncertainty of a team winning will impact viewership. In general, a more unevenly matched game will have fewer viewers, as everyone assumes they know the outcome already. Given the lower uncertainty in the Chiefs versus the Buccaneers this year, our model predicted a lower probability for fans tuning in and therefore viewership for this year’s game.
No model is perfect the first time and while this prediction was 99.6% accurate, there were a lot of dead-ends, late nights and endless hours of hard thinking to get there. We also don’t expect it to be 99% accurate every time. Every machine learning model aims to provide more context and intelligence than it had before, and to get smarter and more accurate results with more time.
What do QSR, delivery, on-demand and food retail businesses do with this demand intelligence
Live broadcast sports events have a significant impact on restaurants, retail and delivery, as well as food and beverage providers. Knowing which counties will be most impacted (this varies widely during pre-season games and across sports) enables companies to ensure they have enough inventory, staff and delivery partners on hand ready to meet demand.
Recently conducted research about the impact of sports on buying behaviors this year revealed:
76% of sports fans consider ordering food as part of their NFL plans, with 31% ordering-in most games and 17% ordering-in every game.
Most families spend more than $30 on food and drinks to enjoy during a standard meal.
89% of sports fans make purchasing decisions inspired by sport, such as apparel or entertaining (i.e. televisions or outdoor furniture), with 58% making several purchases per season.
As the stay-at-home economy continues to be important, and many pandemic consumer habits continue, tracking the exact impact of sports games on demand gives companies an advantage by ensuring they have the right amount of inventory


