Unlock actionable insights with step-by-step data tutorials


In today's dynamic world, external events can significantly disrupt your carefully crafted plans. From weather fluctuations and holidays to industry conferences and sporting events, these disruptions can lead to missed sales opportunities, inefficient staffing, and ultimately, lost profits.
PredictHQ's AI-Powered Platform is the key to unlocking valuable insights that drive your business forward. By understanding the impact of real-world events on demand planning and forecasting, you can make data-driven decisions to capitalize on every opportunity.
But where do you start? Our new use case tutorials are designed to guide you through the process, giving you the tools and knowledge you need to leverage our data and ecosystem in various ways.
Exploring our tutorials
We understand that navigating a new data source can be daunting. That's why we've created a series of industry-specific use case tutorials within our technical documentation. These step-by-step guides offer a hands-on approach to leveraging PredictHQ.
Whether you're in retail, hospitality, mobility, or a different industry, our guides are tailored to meet your specific needs and challenges – so you can learn how to transform raw data into actionable insights that directly impact your business decisions.
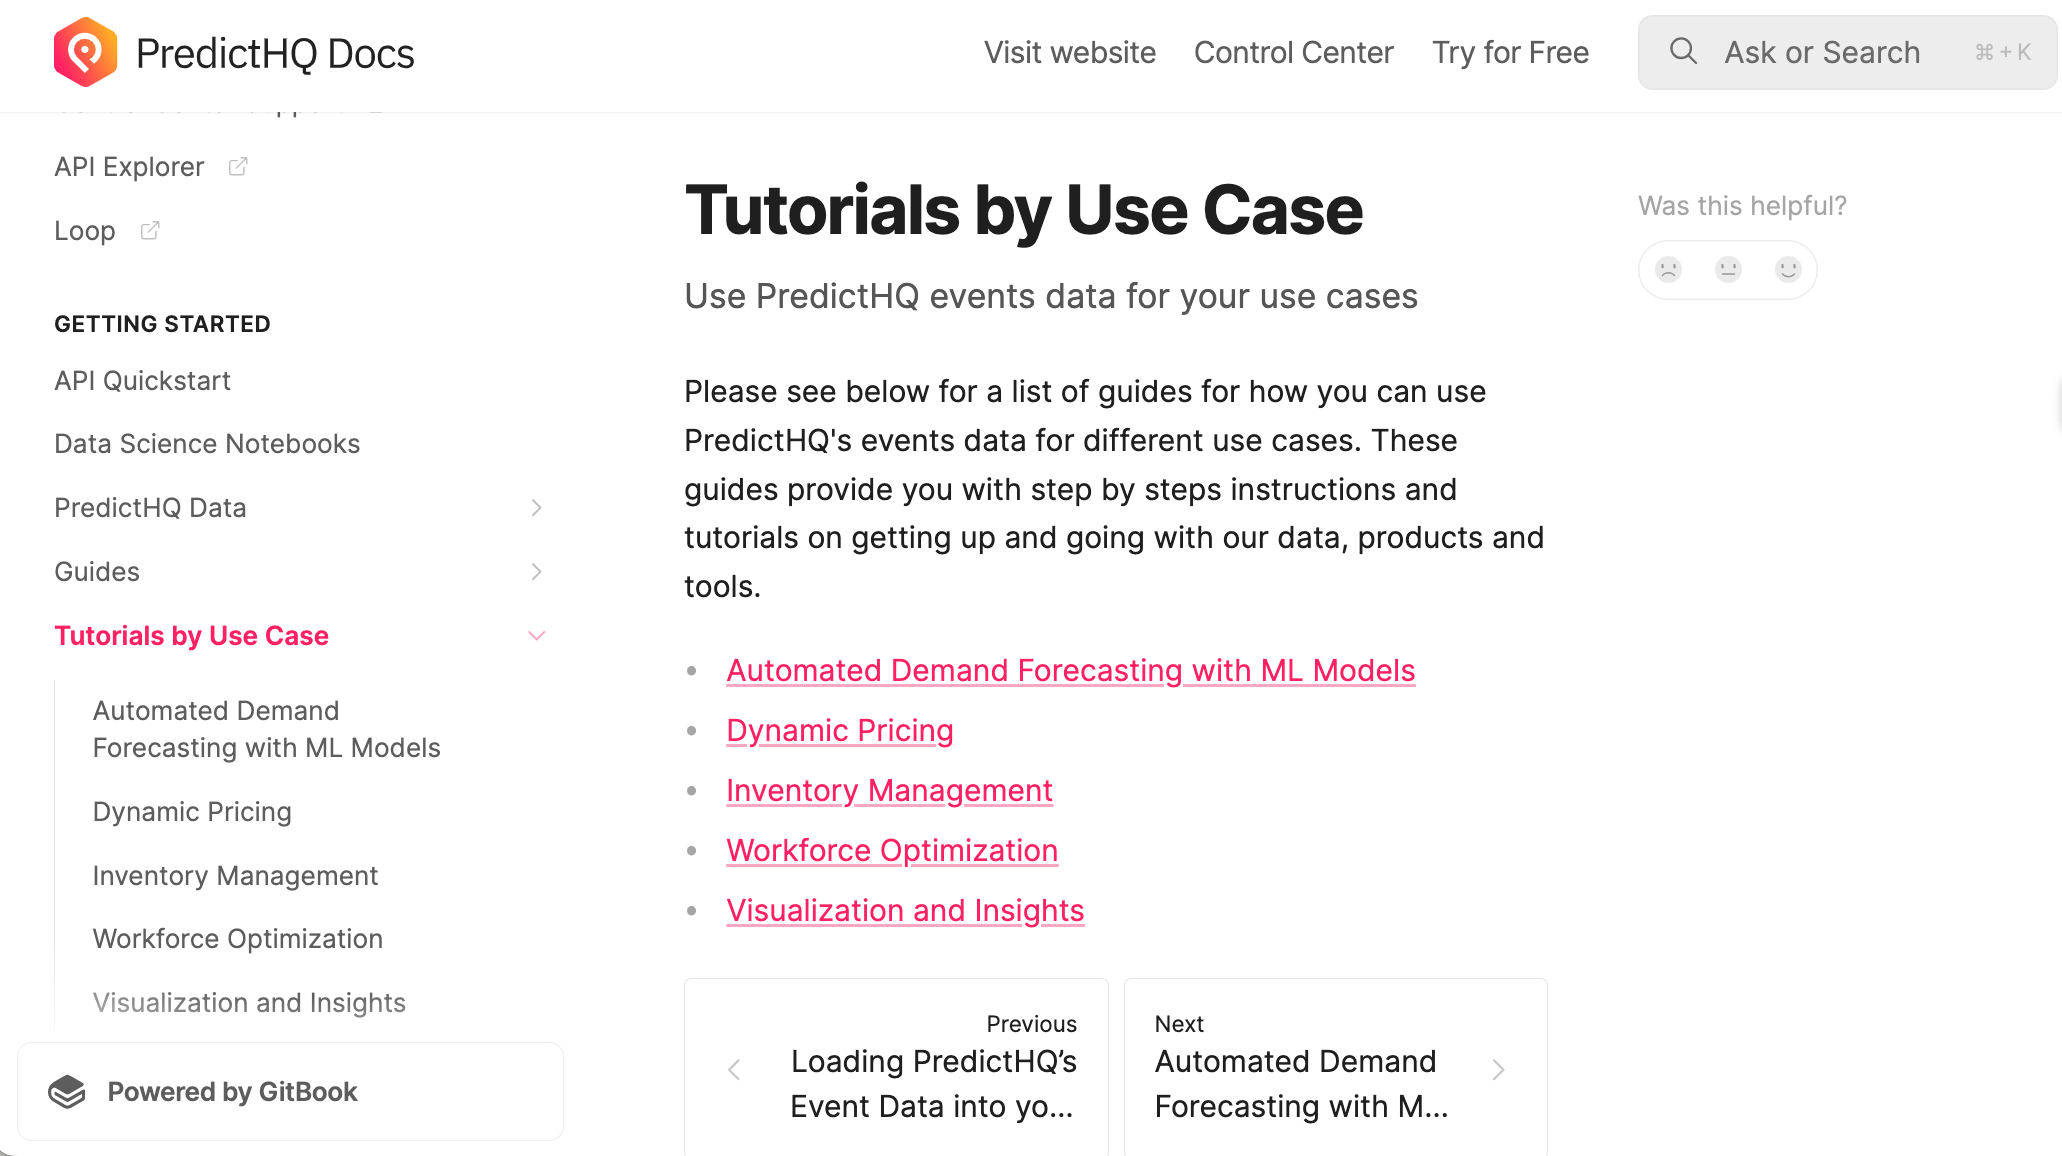
Below are tutorials and industry-specific guides for each of the following use cases:
Automated Demand Forecasting with ML Models: Predict future demand with greater accuracy by incorporating event data into your forecasting models.
Dynamic Pricing: Optimize your pricing strategies to maximize revenue based on anticipated demand shifts caused by external events.
Inventory Management: Avoid stockouts and overstocking by proactively managing inventory levels based on event-driven demand fluctuations.
Workforce Optimization: Align your staffing strategy with event-driven demand to reduce labor costs and boost profitability.
Visualization and Insights: Visualize event data through BI tools such as Tableau or Observable to better understand impact.
Don't let the volatility of external events hold your business back
With PredictHQ's industry-specific guides and step-by-step tutorials, you'll be equipped to turn data into actionable insights and stay ahead of the competition. Start exploring our technical documentation today and unlock the full potential of PredictHQ’s AI-powered event ecosystem.


