Understand upcoming event impact with the PredictHQ Demand Surge Report


Understand the external factors shaping local demand patterns
A demand surge takes place when events cluster and overlap, boosting local spending levels far above average. From concerts and expos to sporting events, this event economy drives significant people movement and spending, injecting millions into local economies and shaping the demand landscape for businesses of all sizes and industries. But how can businesses capitalize on this predictable surge in demand?
Introducing the PredictHQ Demand Surge Report, a free, comprehensive report which offers a week-by-week analysis of how events will impact consumer behavior and spending in key cities across the United States each month. Think of it as a sort of weather update, but for people movement caused by events and local spending. It’s a quick summary to alert cities, communities, and companies about how impacted by events they will be each week, with four weeks of visibility into the future and two months back.
The report provides a summary of event impact designed to be free and accessible as more businesses tap into the event economy's enormous impact across the US. We publish the monthly report here which summarizes upcoming scores for the cities that will encounter the most dynamic patterns.
How the PredictHQ Demand Surge Report works
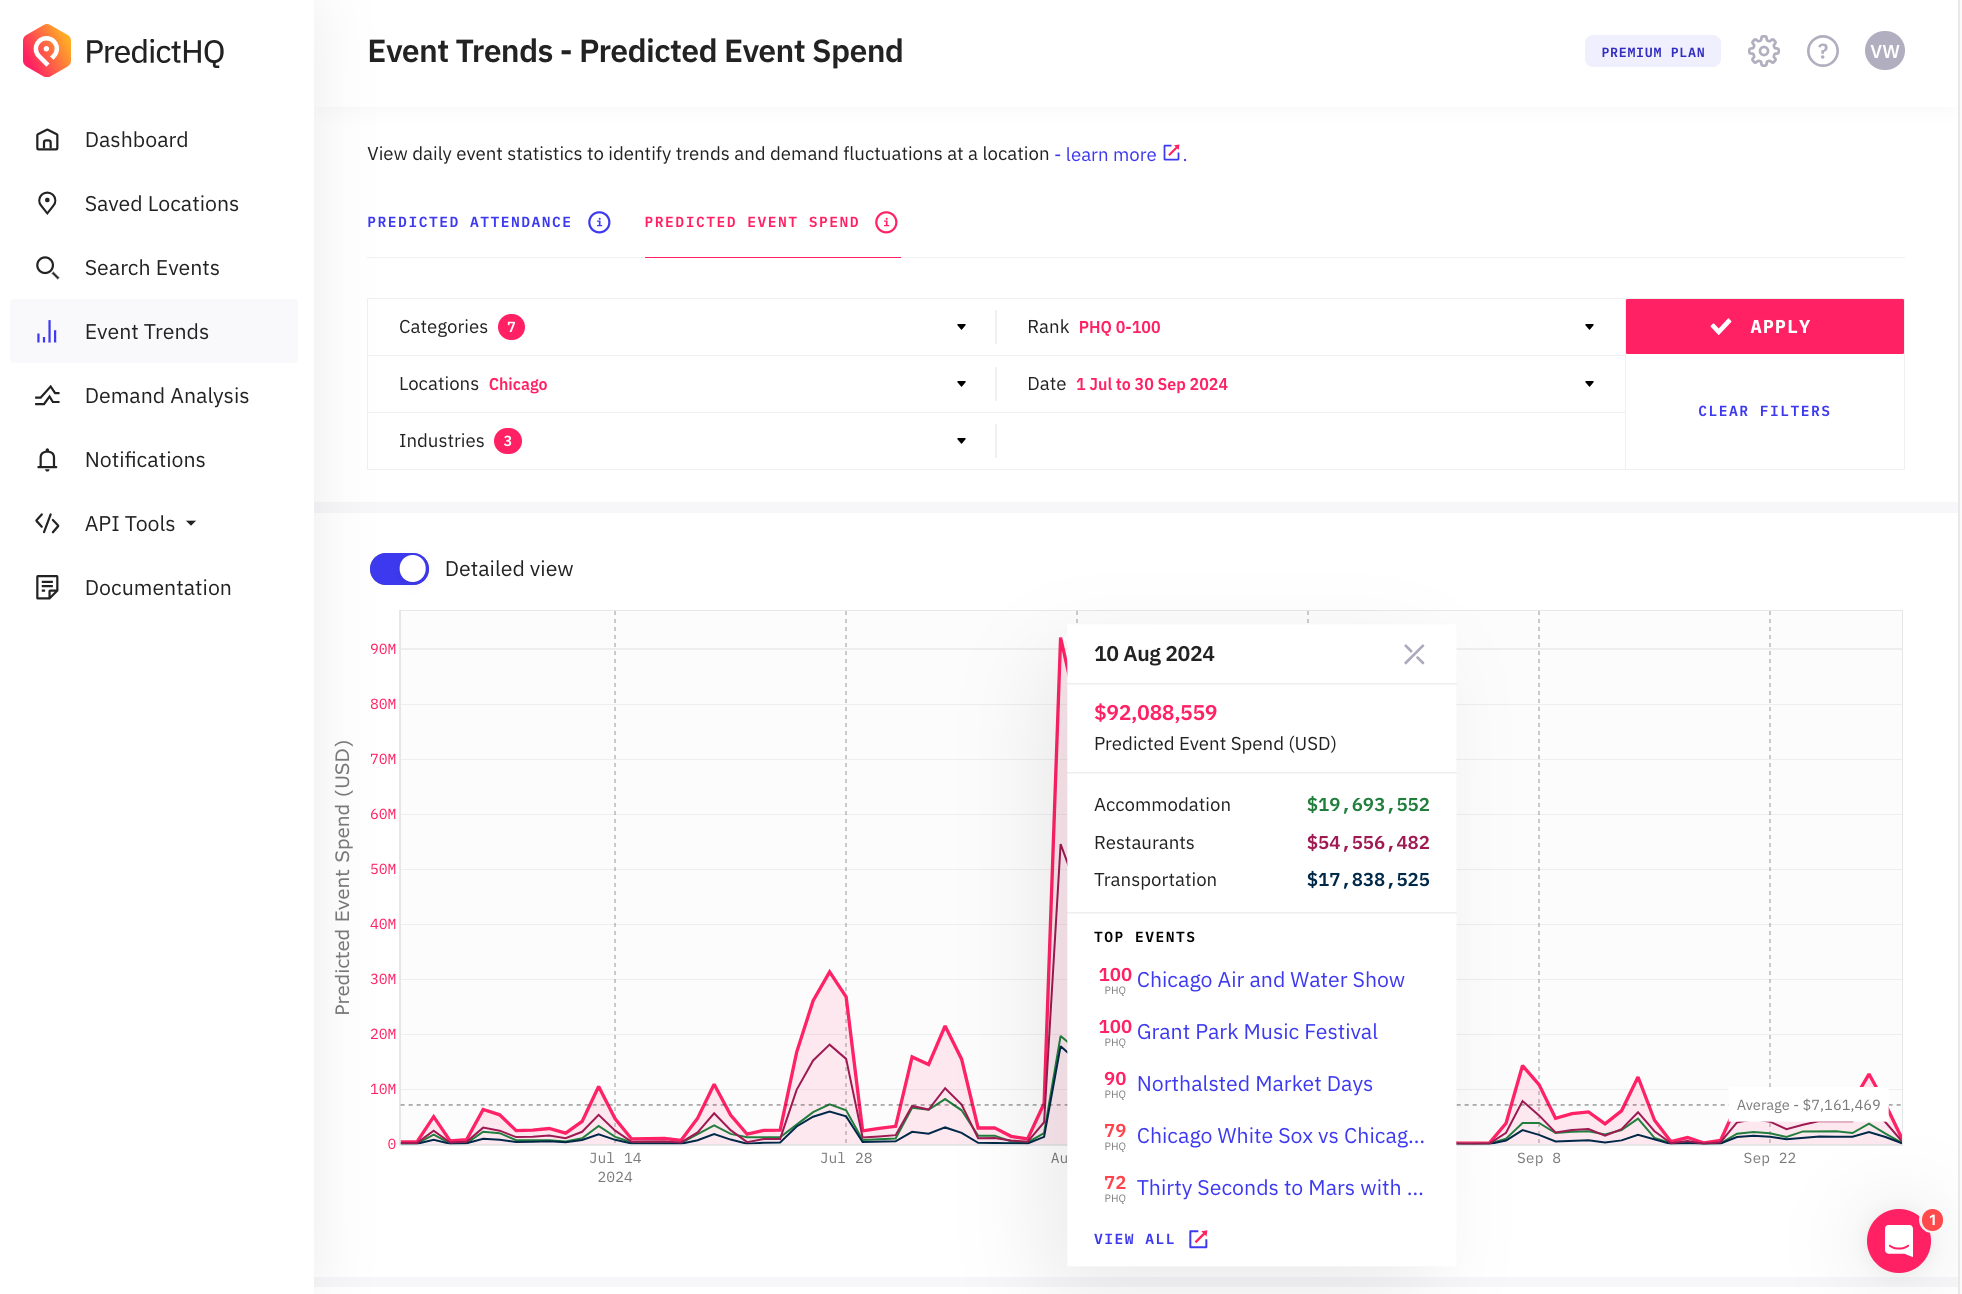
The report is built on algorithms that meticulously analyze event-driven demand impact across several major US cities on a weekly basis. The machine learning models compare event activity for these cities with their historical event activity, combined with predicted attendance, predicted event spend, and more.
It factors in most of our events, excluding our live breaking events which are tracked as they emerge such as severe weather, and our Live TV Events (which forecasts viewership for key sports broadcasts ahead of time). The algorithm for the Demand Surge Report includes impact driven by the following event categories:
Conferences and expos
School holidays (by district)
Academic dates (by institution)
The report goes beyond raw data by comparing each city's aggregate demand score to five years of historical event data. This invaluable context allows us to provide a clear, actionable score (out of 20) that reflects the predicted level of event-driven impact for each city. A few important notes:
Demand surge cities: The report focuses on cities with scores above 15, meaning the area will be significantly busier with higher levels of spending compared to their baseline.
Each city has its own baseline: An event with a predicted attendance of 5,000 may not have a large impact in a city like New York, but would be a much bigger deal in Wichita, Kansas, due to its much smaller population.
Scores are not created equally: This means that a score of 18 in New York may be made up of millions of people, whereas a score of 18 in Wichita may be made up of just over 100,000 people.
Companies that leverage the report's insights can proactively prepare for increased demand and activity, optimizing resources and maximizing profits. Or you can cut out the middleman and create Demand Surge notifications on your own.
Create your own Demand Surge Alerts in seconds
Here’s how to create your own demand surge notifications for the cities and specific locations that matter most to your business:
In our web application, go to Notifications and click the pink “New Notification Trigger” button.
Give your new notification trigger a name. For example, New York Demand Surge.
Select the type of notification, in this case, you’ll use the “Demand Surge” type, which is already selected for you.
Next, select the location type. You can choose between an entire city, state, or country, etc. or a street address. The street address you use will be a center point, with an optimized search radius around the address.
Select your filters. You can choose to create a notification trigger for any of the attendance-based event categories PredictHQ tracks. Then you’ll select your date range of anytime, the next 7 days, the next 14 days, or the next 30 days. For example if you choose 7 days for your date range, you will be notified of a Demand Surge 7 days in advance.
Choose your Predicted Attendance Threshold (for example, if you enter 10,000 then you will receive a notification once predicted attendance in that area exceeds 10,000).
Under Email Notifications, you can decide to receive your notifications via email by selecting “Send Digest” or “Don’t Send”. If you select “Don’t Send”, you can still view all of your Demand Surge notifications within the notifications section.
If you do opt in for email notifications, you will now select your preferences. This can be set to hourly, daily, or weekly.
Click the “Create new notification trigger” button at the bottom of the page, and you’re done!
Integrate verified, enriched event data into your forecasting
If you are seeking reliable external data for your demand forecasting, The Demand Surge Report is just scratching the surface of what predictive demand intelligence can do for you.
PredictHQ tracks 19 categories of events, from scheduled and attended events such as sports games, festivals and expos through to unscheduled events such as severe weather and natural disasters, and other impactful events such as school holidays, academic dates and public holidays.
Uber, Domino’s Pizza, and Accor Hotels are some of the many businesses that use our event data and intelligence to identify which of the hundreds of thousands events each week will impact their demand — so they can create dynamic and accurate plans for staffing, inventory, pricing and more. Join the ranks of leading companies using predictive demand intelligence to master predictability and take control of demand volatility at scale.


