Creating an analysis in Beam
Use Beam to find correlation between your demand and events data
Creating an analysis in Beam
When you log in to Control Center as a user, you will see the Beam tab on the left-hand side menu bar:
Clicking on the Beam icon will direct you to an empty screen with no analyses found. However, if previous analyses were carried out and not deleted, these will be displayed on this page.
An analysis using Beam means that you have uploaded demand data for a specific location, within the time period defined by the uploaded data. Beam takes the demand data together with PredictHQ daily aggregated attendance data to look for the effect on demand caused by events and finds a correlation. The results are shown in different formats:
AI analysis
Interactive plot
Table
PDF report
Export a CSV
Each visualization contains information on the correlation analysis determined by Beam.
To initiate the analysis in Beam, click on Create New Analysis in the top right-hand corner, and you should see the screen below, prompting you to input details about your business.
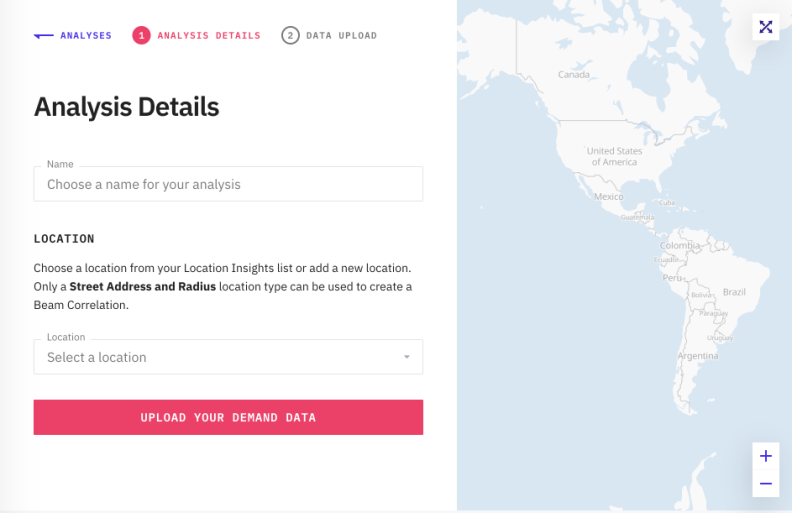
Name
Input the desired name of your analysis. This is free form, but suggest inputting a name that you can recall and differentiate if subsequent similar analyses are made.
For example: nameofuser_daterange_analysisdate_analysiscount.
nameofuser: Record multiple users or departments testing out Beam for different purposes.
daterange: Represents the range of dates within the data set that should be able to distinguish between two analysis across different periods.
analysisdate and analysiscount: The date of analysis and the number of the analysis to keep track of multiple analyses.
For example JSmith_Boston_2018_20200403_1
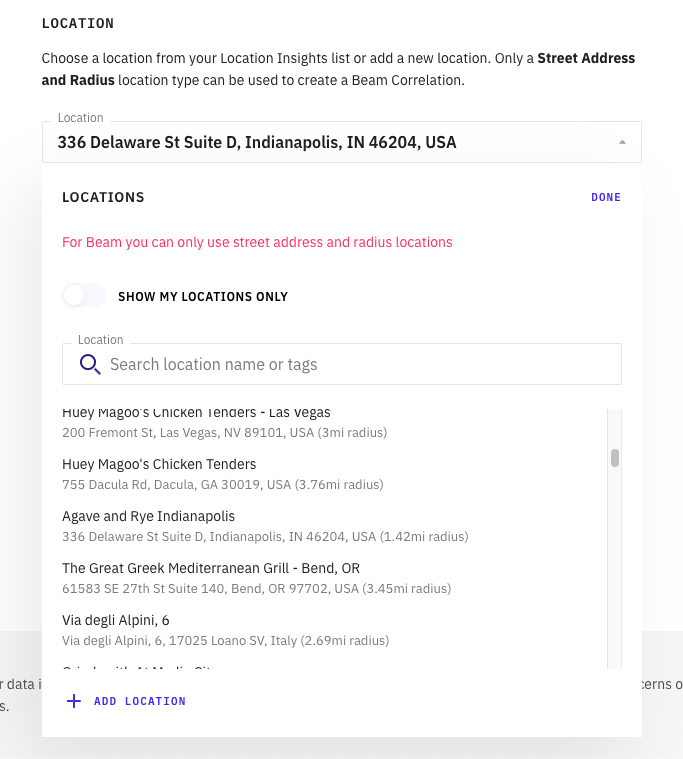
Location
When creating an analysis in Beam, it's essential to specify the location of interest. You can specify the location of interest by simply selecting a location from your Location Insights list or adding a new one. Remember, only a Street Address and Radius location type are suitable for Beam Correlation.
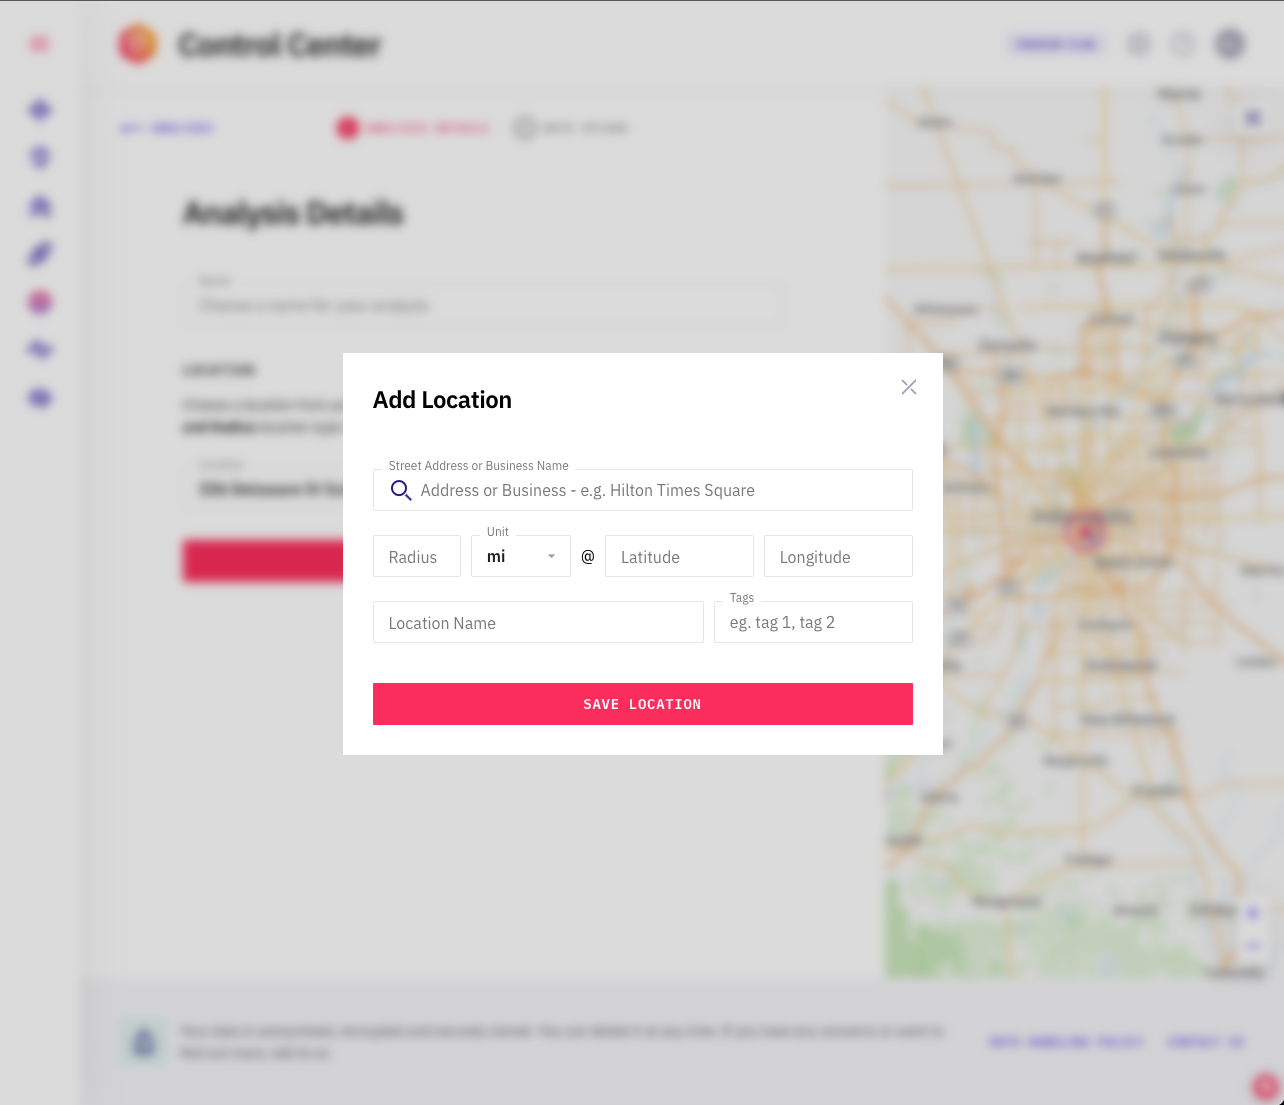
To add a location, click the "Add Location" button in the Location dropdown menu. Check here for more details.
For the next step see how to upload your demand data to Beam