How one QSR scored big on Super Bowl Sunday


The Super Bowl is a showdown of epic proportions. But it's not just the teams on the field competing – the QSRs off the field are battling for the hearts (and stomachs) of football fans. Today, we’ll dive into the details of how one recent Super Bowl drove sales up for one QSR, while driving it down for another one next door.
The battle of the QSRs: How Super Bowl LIII influenced demand for fast food options
The Super Bowl is notorious for being a major day for food consumption, particularly for quick service restaurants. Many QSRs experience a significant increase in sales on the day of the Super Bowl, as people gather to watch the game with friends and family and often order food from restaurants to enjoy during the event. While some QSRs experience a spike in demand around the Super Bowl and events like it, there are businesses that experience a decrease in demand.
By using PredictHQ's Demand Analysis Tool, our data science team was able to determine which types of QSRs were impacted by a recent Super Bowl game and how. The tool combines and correlates intelligent event data with a business's historical sales data to understand the relationship between events and their demand. By aggregating the data to prove consistent correlations between demand and certain types of events.
Store locations for one national fast food chain saw an almost 90% increase in in-store demand on Super Bowl Sunday, while another leader in the fast-casual space saw the exact opposite trend with a 30% drop in in-store demand – despite being in the same exact New Jersey neighborhood.
While the figures varied, this trend was observed country wide on Super Bowl day between these two competing brands where one saw a spike, and the other a decline over the span of multiple different years. The demand impact image below shows the spike in demand for one QSR, and a sharp decline in demand for the other on Super Bowl Sunday over the span of two consecutive years:
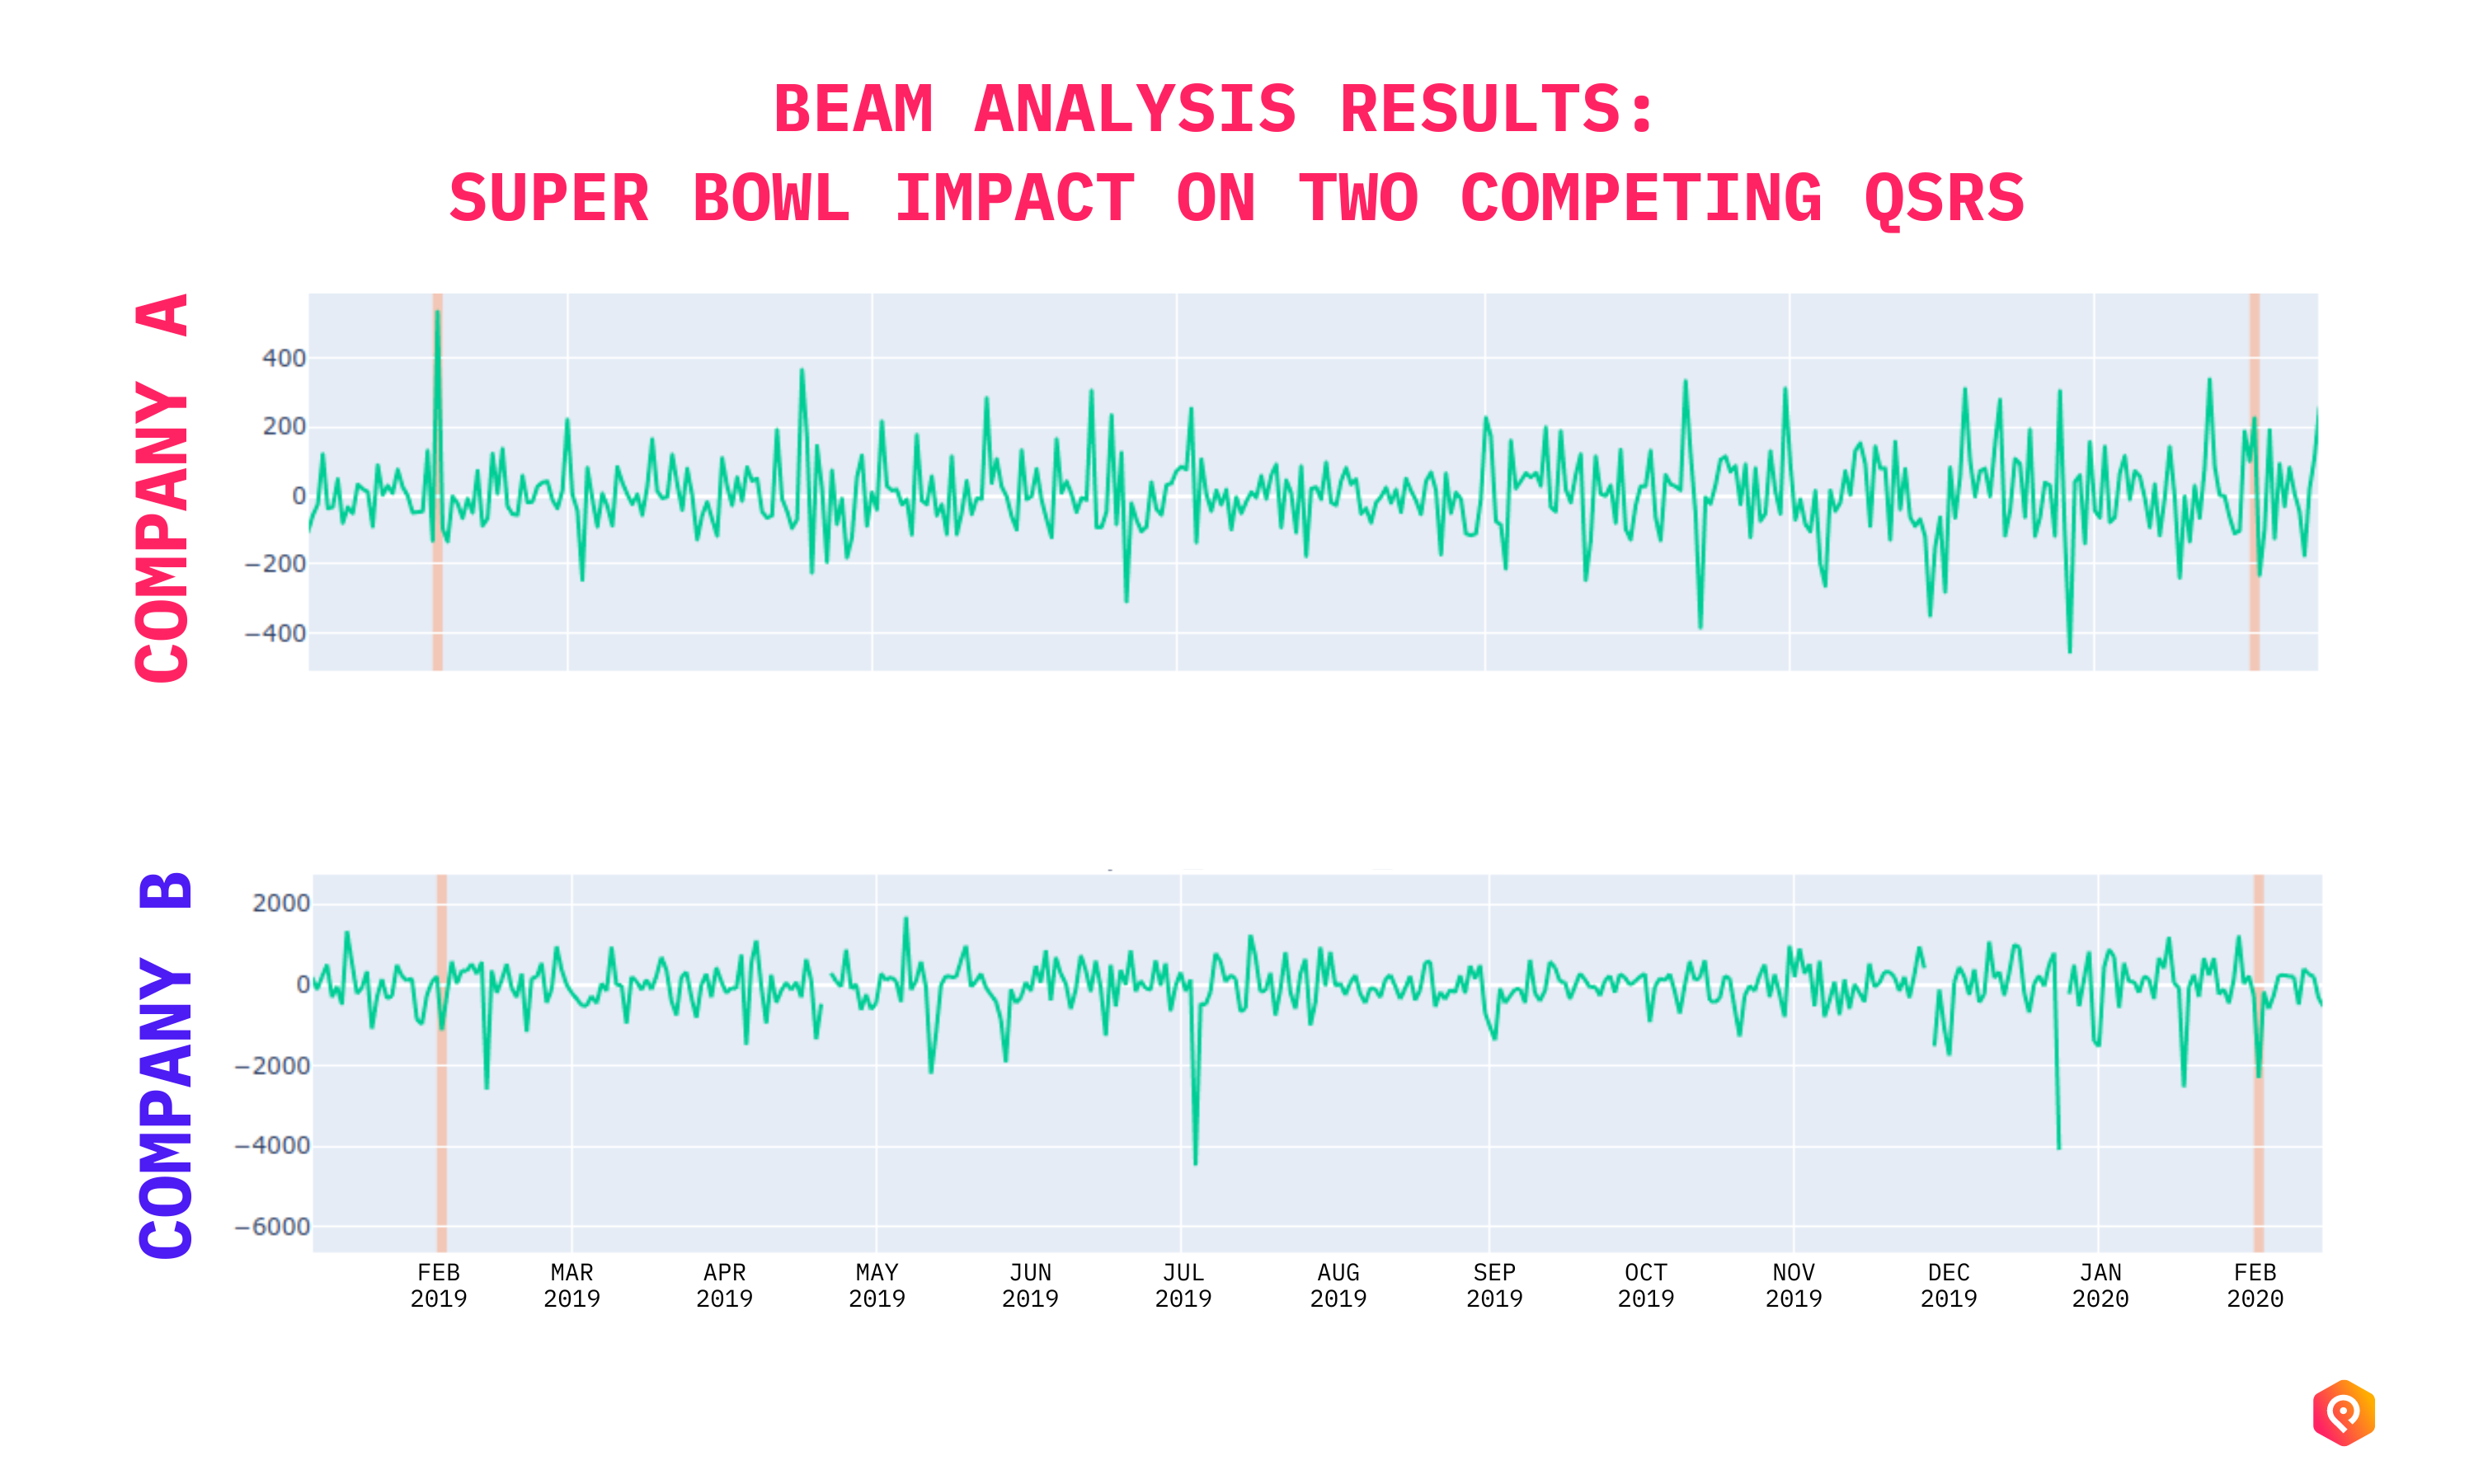
In the graph, the green line represents transactional demand, and the orange bar represents the Super Bowl which took place in February 2019. The graph on top, Company A, shows an increase in demand within the orange bar – while during that same exact time, Company B, shown in the bottom graph, shows a sharp decline in demand within the orange bar. This same trend was observed a year later in 2020 when Company A saw another increase in demand, and Company B saw an even sharper decrease in demand than the year before.
Why the Super Bowl impacted these QSRs in opposite ways
Even though both companies operate within the fast-casual space, even neighboring QSR locations are often impacted by the same event in different ways. This challenges general assumptions that high-visibility TV events drive demand in a uniform way for all QSRs. The same event impacting demand so differently for the two QSRs may be explained by:
1. Marketing and advertising
One of the highest impact ways companies can use events beyond forecasting is in marketing. The right event-based marketing, especially around events such as the super bowl, can boost brand awareness and drive viewers to order your products for delivery during the game. For example, running targeted ads or promotions during the game, special deals, or limited-time offers.
2. Take out and delivery
The company that received the huge surge invests heavily in their delivery offering and uses county-by-county predicted TV viewership data to know exactly where drivers need to be. This repeat performance means that customers trust this company to deliver fast, hot food with minimal fuss – even on peak demand days such as the Super Bowl.
3. Location, location, location
Store location can also play a role in the difference in demand. While in this example, both of these QSRs are located in the same area, other factors such as the demographics, population density, and the consumer's preference within that specific location could play a role. It's possible that people in that area simply have a stronger preference for one type of food over another.
QSRs of all types can use Demand Analysis to identify the events that have historically brought them more foot traffic and demand, and focus strategic efforts around those events. At a glance, it’s not easy to pinpoint which events matter most to your business – but with event visibility, it is.
Correlating your historical data against intelligent event data unlocks opportunities for fast casual restaurants of all sizes to fine tune demand planning in preparation for opportunities such as the Super Bowl, lesser-known sports events, and really any one of our 19 event types that may still be driving demand. Let’s take a look at how the tool works to reveal the relationship between these types of events and your business.
How Demand Analysis works to accurately predict how televised sports events will drive demand up – or down – for your business locations
Our Demand Analysis tool is designed to help businesses identify how certain events, such as televised sports events, have historically driven demand for their locations. It is used to analyze data from past events to predict how future events may impact demand for a QSR. Here's how Demand Analysis works to help QSRs identify how the Super Bowl drives demand for their game day menu options:
Collecting data: The QSR provides PredictHQ with data on past sales.
Analyzing data: Demand Analysis then uses this data to analyze the correlation between events (including the Super Bowl) and sales for the QSR.
Demand planning: A completed analysis based on historical impact provides a thorough understanding of what future impact will likely look like – so you can make decisions to prepare for the Super Bowl accordingly. For example, by adjusting staff schedules, ordering more supplies, and promoting specials to attract more customers.
The tool also helps to identify other types of events that may impact business demand such as concerts, festivals, and holidays. This powers the ability for QSRs to be proactive in planning and preparing for the fluctuations in demand caused by impactful nearby events.
Looking to score big this year? The 2023 Super Bowl is predicted to drive millions in spending
This year, the predicted event spend for Super Bowl weekend (February 9 - 12) is $123,780,000, with restaurants representing $34.8 million of the spending – and this is in Phoenix, Arizona, alone. Use PredictHQ to reveal your demand catalysts today to prepare not just for Super Bowl LVII – but for the thousands of other sports games, televised sports events, and other event categories that may be impacting your demand. Learn more about how to track events influencing demand for your business locations.


