5 ways on-demand companies use event data to avoid traffic for faster deliveries


Few things are more frustrating than realizing your customers are going to be waiting longer than you promised, especially when it’s not something your team can solve immediately. One of the highest impact factors outside of your control is traffic, the nemesis of the on-demand industry. Whether your app is sending a driver; planning hire-bike replenishment; dispatching groceries or meals, or looking after a mid-party liquor stock up, your company prides itself on dependability and quick turn-around, so you probably hate traffic even more than your customers do.
While you can’t control traffic, you can use event data to preempt and avoid it before it even begins to clog up roads. Getting ahead of the traffic (and traffic apps/services, and therefore your competitors) is a serious advantage as it enables you to promise shorter delivery times and more reliable customer service.
Our event data is used by multiple leading rideshare, grocery and snack delivery companies, so we want to share some of the ways that event data can help on-demand companies skip the traffic for happier customers.
1. Identifying major events and their predicted attendance so your drivers and logistics teams can avoid them
Event data makes your team and your machine learning models real-world aware so you can plan for traffic and delivery disruptions hours in advance. This not only means you can avoid traffic or devise the best possible strategies around it, it also enables you to provide more accurate delivery and/or arrival estimates for customers than the on-demand services that are less proactive and less data driven.
For example, let’s say your route models included events in Austin, Texas for the weekend of March 24 to 27th. Here are some of the larger events that weekend plotted on a map:
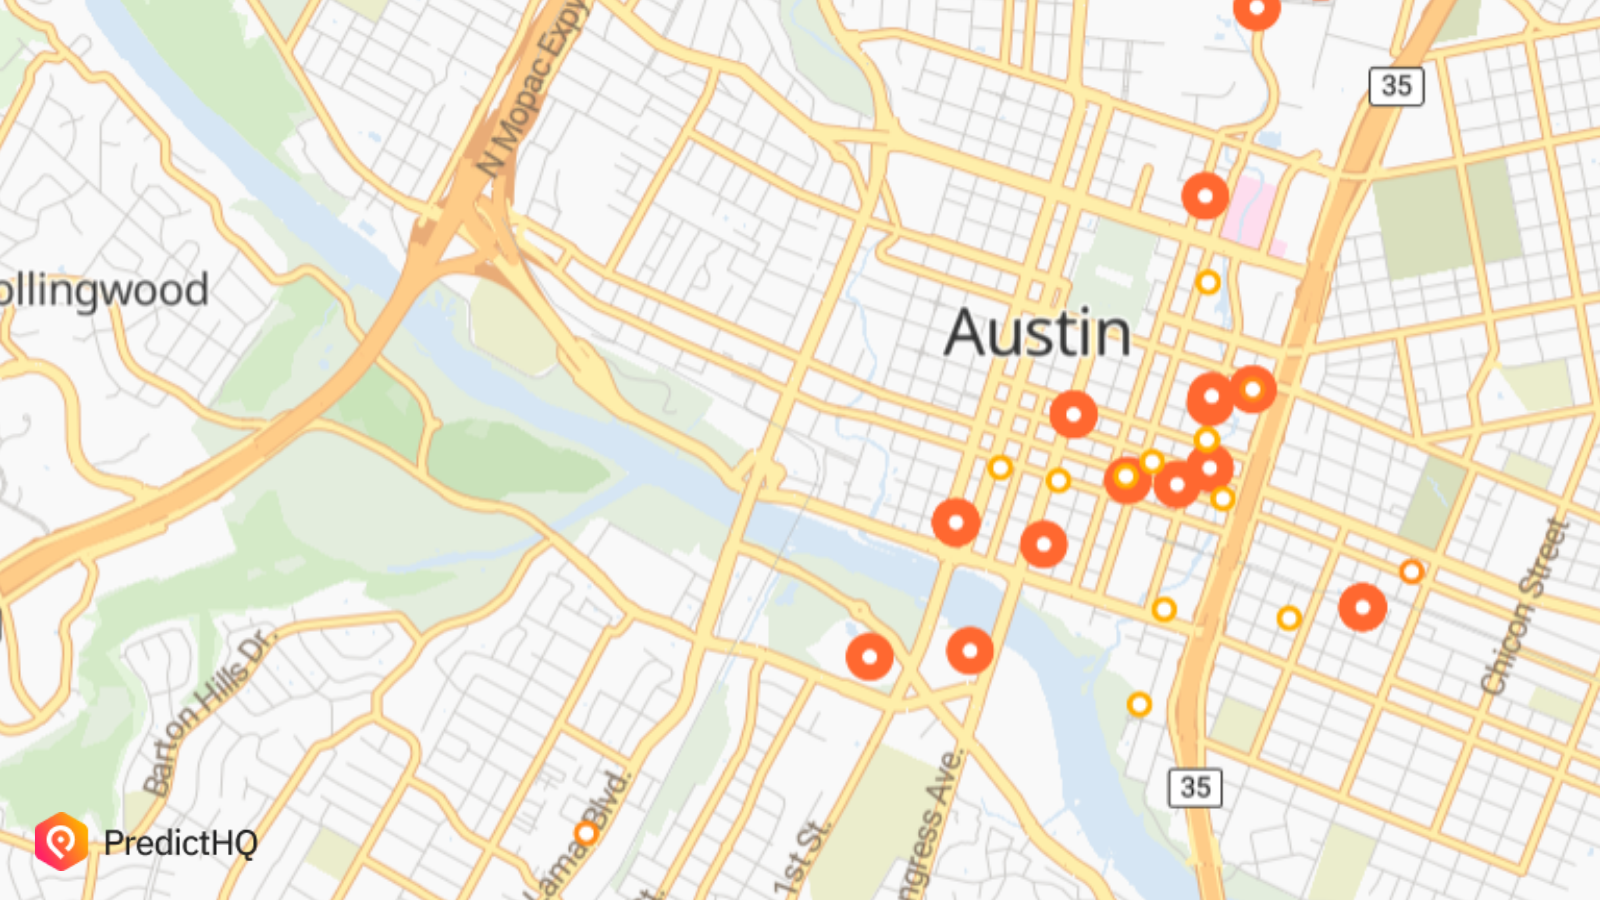
You had probably already added the four NASCAR events with more than 120,000 people into your plans, but what about the Club Friendlies 3 soccer match with Monterrey vs America on Saturday evening with more than 9,000 people attending, or the Cats ‘n’ Dogz and Robin Hood Concert with 3,000+ attendees, which kicks off shortly after the big soccer game ends?
Knowing where and when large events are starting and ending gives your team the ability to proactively plan to avoid the congestion these cause on the roads.
2. Identifying clusters of smaller events that combined have attendance levels similar to major events
While big events are somewhat easier to know about, it’s the combined impact of events happening in an area that can impact traffic in unexpected ways for those who lack event data with accurate predicted attendance.
While one event of 100,000 people is easier to know about, it’s clusters of smaller events or events nearby large events that attendees will be using the same roads to attend that can cause sudden traffic congestion that can delay your deliveries or arrivals significantly.
For example, in San Francisco on March 25 there were 28 events. Your teams and models may have known about the Game Developers Conference with more than 25,000 attendees, as well as the two NCAA games that evening at the Chase Center, but what about the seven other concerts or performances that night with 900+ attendees? Or the other seven with 300+ attendees?
Rideshare companies as well as other mobility companies need to know about all of these to tap into demand, but the on-demand meal, grocery and liquor delivery companies that knew about each and every one of these was also better able to avoid the traffic snarls they caused well in advance, meaning faster deliveries, more reliable delivery estimates and happy customers heading into their weekend with a great experience on your app.
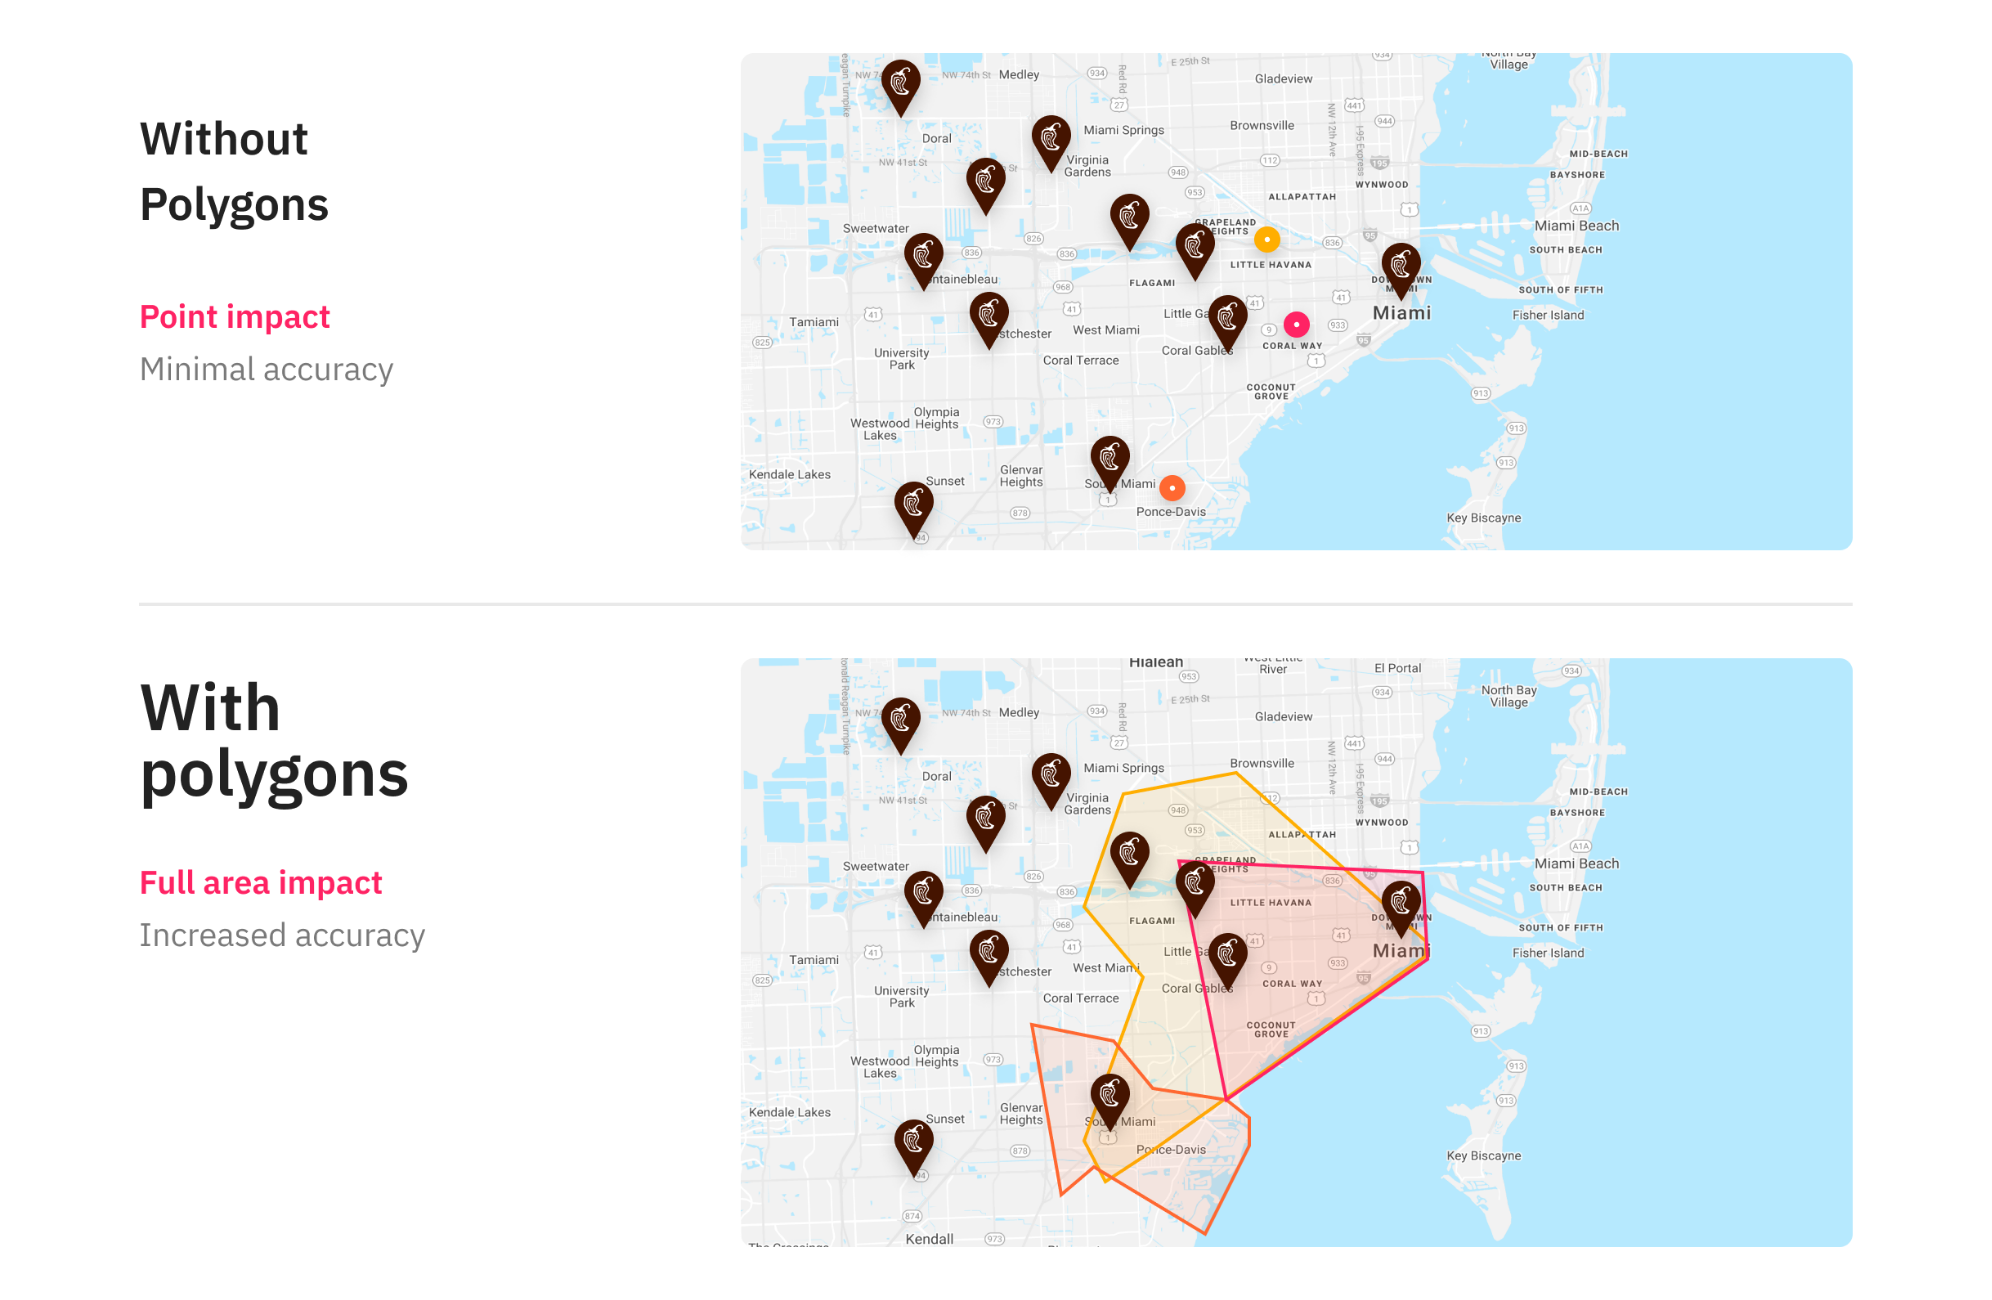
3. Pinpoint the impacted area (i.e. traffic routes events) of events such as marathons, parades and school holidays
An expo or sports game has a designated location, as well as a start and end time. This makes them reasonably simple to estimate and identify the impact on traffic and delivery times, but what about events that are either route-based, like a marathon or parade, and therefore far more disruptive to traffic, or distributed and sustained, such as school holidays?
Receiving information on events such as marathons and parades as polygons enables your delivery/traffic models and teams to more accurately understand and prepare for their impact. By analyzing which upcoming multi-road events will interrupt frequently used roads or routes, you are better able to avoid this impact. PredictHQ tracks both events as polygons, so you can easily access this information.
Similarly, if a parade or marathon’s route and the related surge in food traffic is likely to impact access to restaurants or warehouses that supply your drivers, you can factor this into their planning also.
We also use polygons to reflect the impact of school holidays at the district level. School holidays impact traffic (especially at the beginning and end of the holiday periods) as well as demand and driver availability, so are important for on-demand companies to track.
4. Track live disruptive events at scale with important detail your teams or machine-learning models can process quickly
The first three tips are about traffic that will be caused by events you can see coming. But we all know traffic jams can be sparked by surprise events as well, and that’s where notifications and tracking live breaking events is so valuable.
For example, here’s some of the ways you could respond to the live breaking events PredictHQ tracks:
An incoming severe weather event has been upgraded from “watch” to “warning” for a significant neighborhood or route for your company. This is likely to have impact on both demand and traffic, so receiving an alert as soon as it’s verified and closely monitoring its emerging impact means you can decide to lean into the disruption by sending more workers towards the region, or begin organizing routes around the impacted region for both traffic management as well as which warehouses you’re collecting orders from, or delivery estimation windows.
A series of flight delays means demand for drivers has dropped off at the airport notably, causing drivers to head out to find other gigs. But as these flights finally arrive, this shortage will cause a serious surge of demand so tracking when to incentivize or communicate with drivers to head back before every other delivery app does and the traffic jam kicks in is a valuable tool.
Events such as sudden severe weather warnings and events, natural disasters, as well as terrorist attacks are important to track for driver safety, risk management and proactive customer support. Whether that’s explaining why your service is on hold, why wait times are long, or turning off customer-facing surges to avoid PR backlash, being aware of the challenges out in the world means you can manage both traffic and related customer experiences well.
5. Understand how major events impact driver supply for faster deliveries during busy times
Sometimes, when you’re looking at peak demand periods that coincide with busy event periods that will create more traffic, the best solution is simply more human-power. Event data is a powerful tool for building driver and independent worker loyalty and one you can use to ensure gig economy workers choose your app when the going gets busy.
Using events to proactively empower your drivers to plan their work schedules on your app as well as improve your algorithms for forecasting and incentivization is a key use case for our on-demand customers. Here are some of the ways events impact driver or delivery worker availability:
School holidays often lead to a drop in driver availability as parents need to stay home and look after their kids. Pre-empting this and ensuring you are ramping up driver recruitment and onboarding, as well as potentially changing your driver incentives ensures you have enough share of the driver and delivery worker market to keep your customers happy.
College holidays and key dates have a less uniform impact, as they can drive both a sudden spike in driver availability in some locations as well as drop off in demand for rides, orders and more. Knowing when exams, breaks and session commencements gives your team unique insight into incoming impact.
Clusters of events: similar to point two above, knowing when there is likely to be a sudden surge of demand caused by clusters of under-the-radar events that drive demand ensures you can send your drivers towards demand or back to your warehouses to standby for orders, shortening both driver/deliver idle time (so they’re less likely to switch apps) and delivery time for your customers.
On-demand businesses have to be real-world aware, and event data is critical to understanding how traffic, people and demand flow through your key neighborhoods. PredictHQ works with many leading on-demand businesses and would love to assist you to take your demand forecasting, planning and more to the next level.


