Unlock the impact of events with PredictHQ’s improved API Explorer


PredictHQ’s API Explorer provides a quick and easy way to look at the capabilities of our API and to get sample code that you can run in your environment. By using this, you can test out the capabilities of our APIs to see how they can directly translate into better forecasting and smarter business decisions for your specific business.
We're excited to announce some improvements to the PredictHQ API Explorer and added support for the APIs listed below. Some of these might be APIs that you are not currently using — which could be the key to unlocking hidden potential in your data.
Use the Saved Locations API to track events impacting your business
The Saved Locations API has been added to API Explorer. Saved Locations show insights into events happening around a location. Business locations include stores, hotels, restaurants, parking garages, offices, or any other type of location you can think of. The API allows you to retrieve insights into how events could be impacting your business at a location that matters to you such as upcoming busy days.
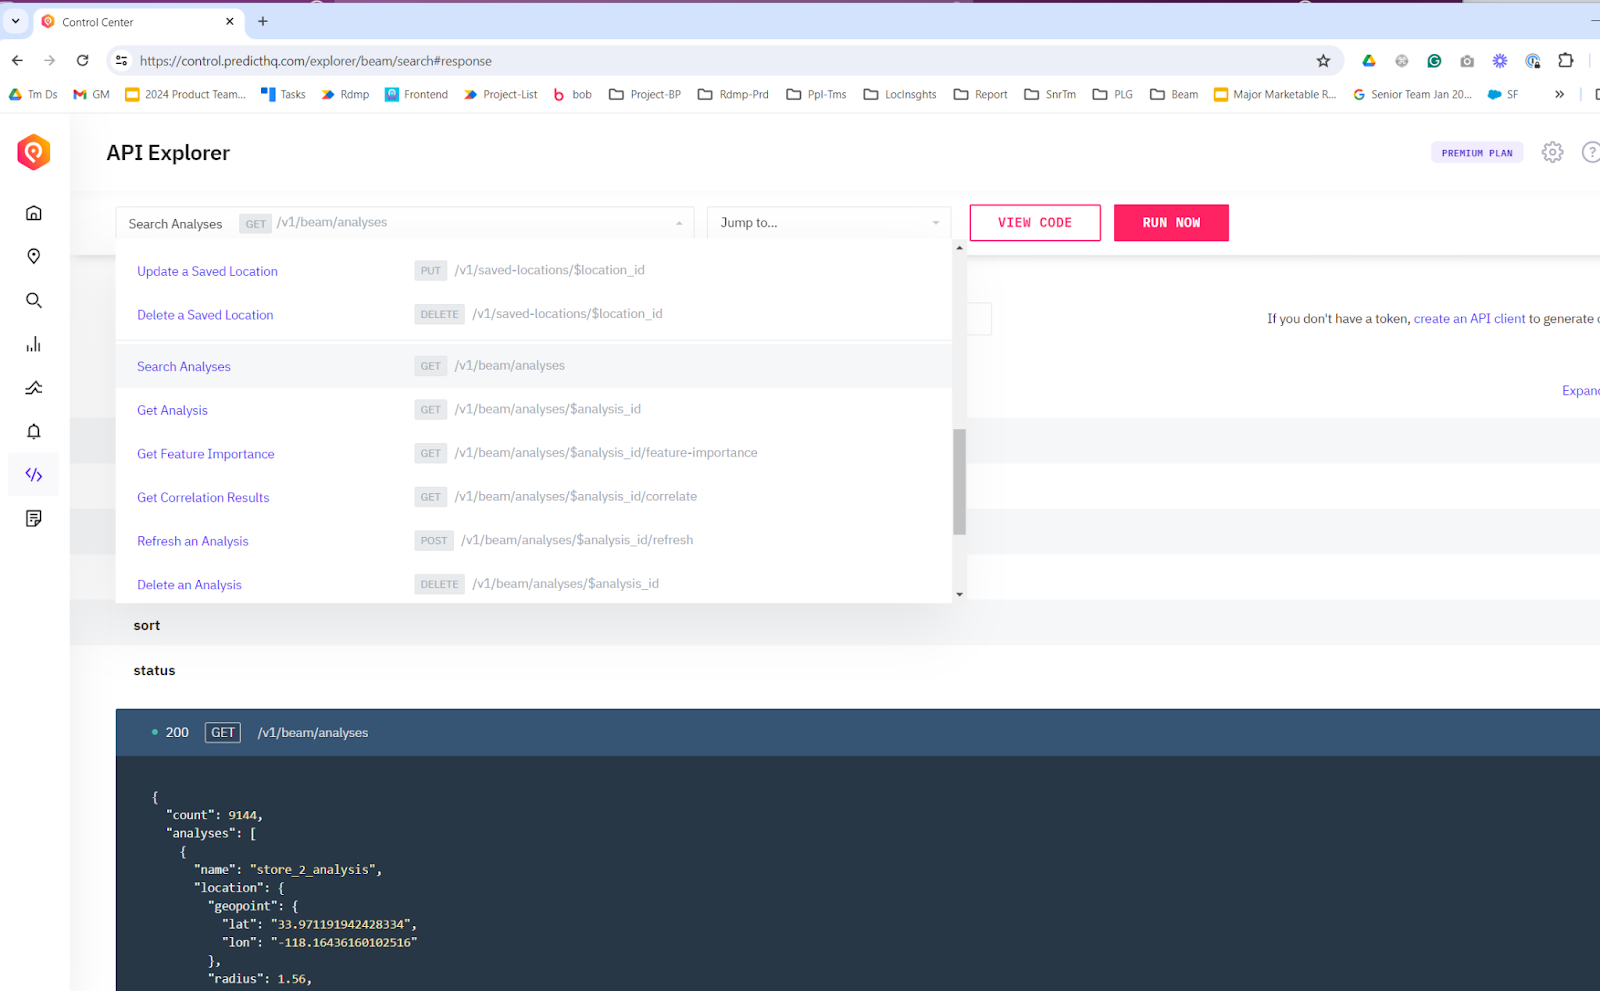
The API support in API Explorer for the Saved Locations API includes getting a location, creating a location, searching locations, getting events for a location, updating a location, and deleting a location. Use the Saved Locations API to bulk upload hundreds or thousands of locations, to get stats for locations, and to get events for locations. It allows you to implement the equivalent of what we have in our web application, Control Center, for Saved Locations in your own app or tools. Having this functionality in API Explorer helps with discoverability and to get you up and running quickly.
For example, you can use the API to implement the functionality shown below in your own app:

Identify key demand drivers with the Beam API
The Beam API has been added to API Explorer. Beam is our demand analysis tool which helps you identify which events have impacted your demand in the past, to help you make better decisions in the future. Beam’s category importance feature tells you which event categories are having the greatest impact on your demand. To use Beam, you simply upload your historical demand data and the output will be the results of an analysis of how events and what types are impacting your specific demand.
Beam is also used to identify event-based Machine Learning features that you can use to train a demand forecasting model. You can use the Beam API to bulk upload analyses for thousands of locations. Beam also allows for seamless integration into your workflow, enabling automated data exchange — it can push data to Beam for analysis, and then pull back the category importance results to directly train your model.
The Beam API includes support for getting a list of analyses, creating an analysis, uploading demand data to an analysis, getting feature importance results, editing analysis, and more (for all the API calls listed here). Try the Beam API in API Explorer.
Find relevant events in close proximity with the Suggested Radius API
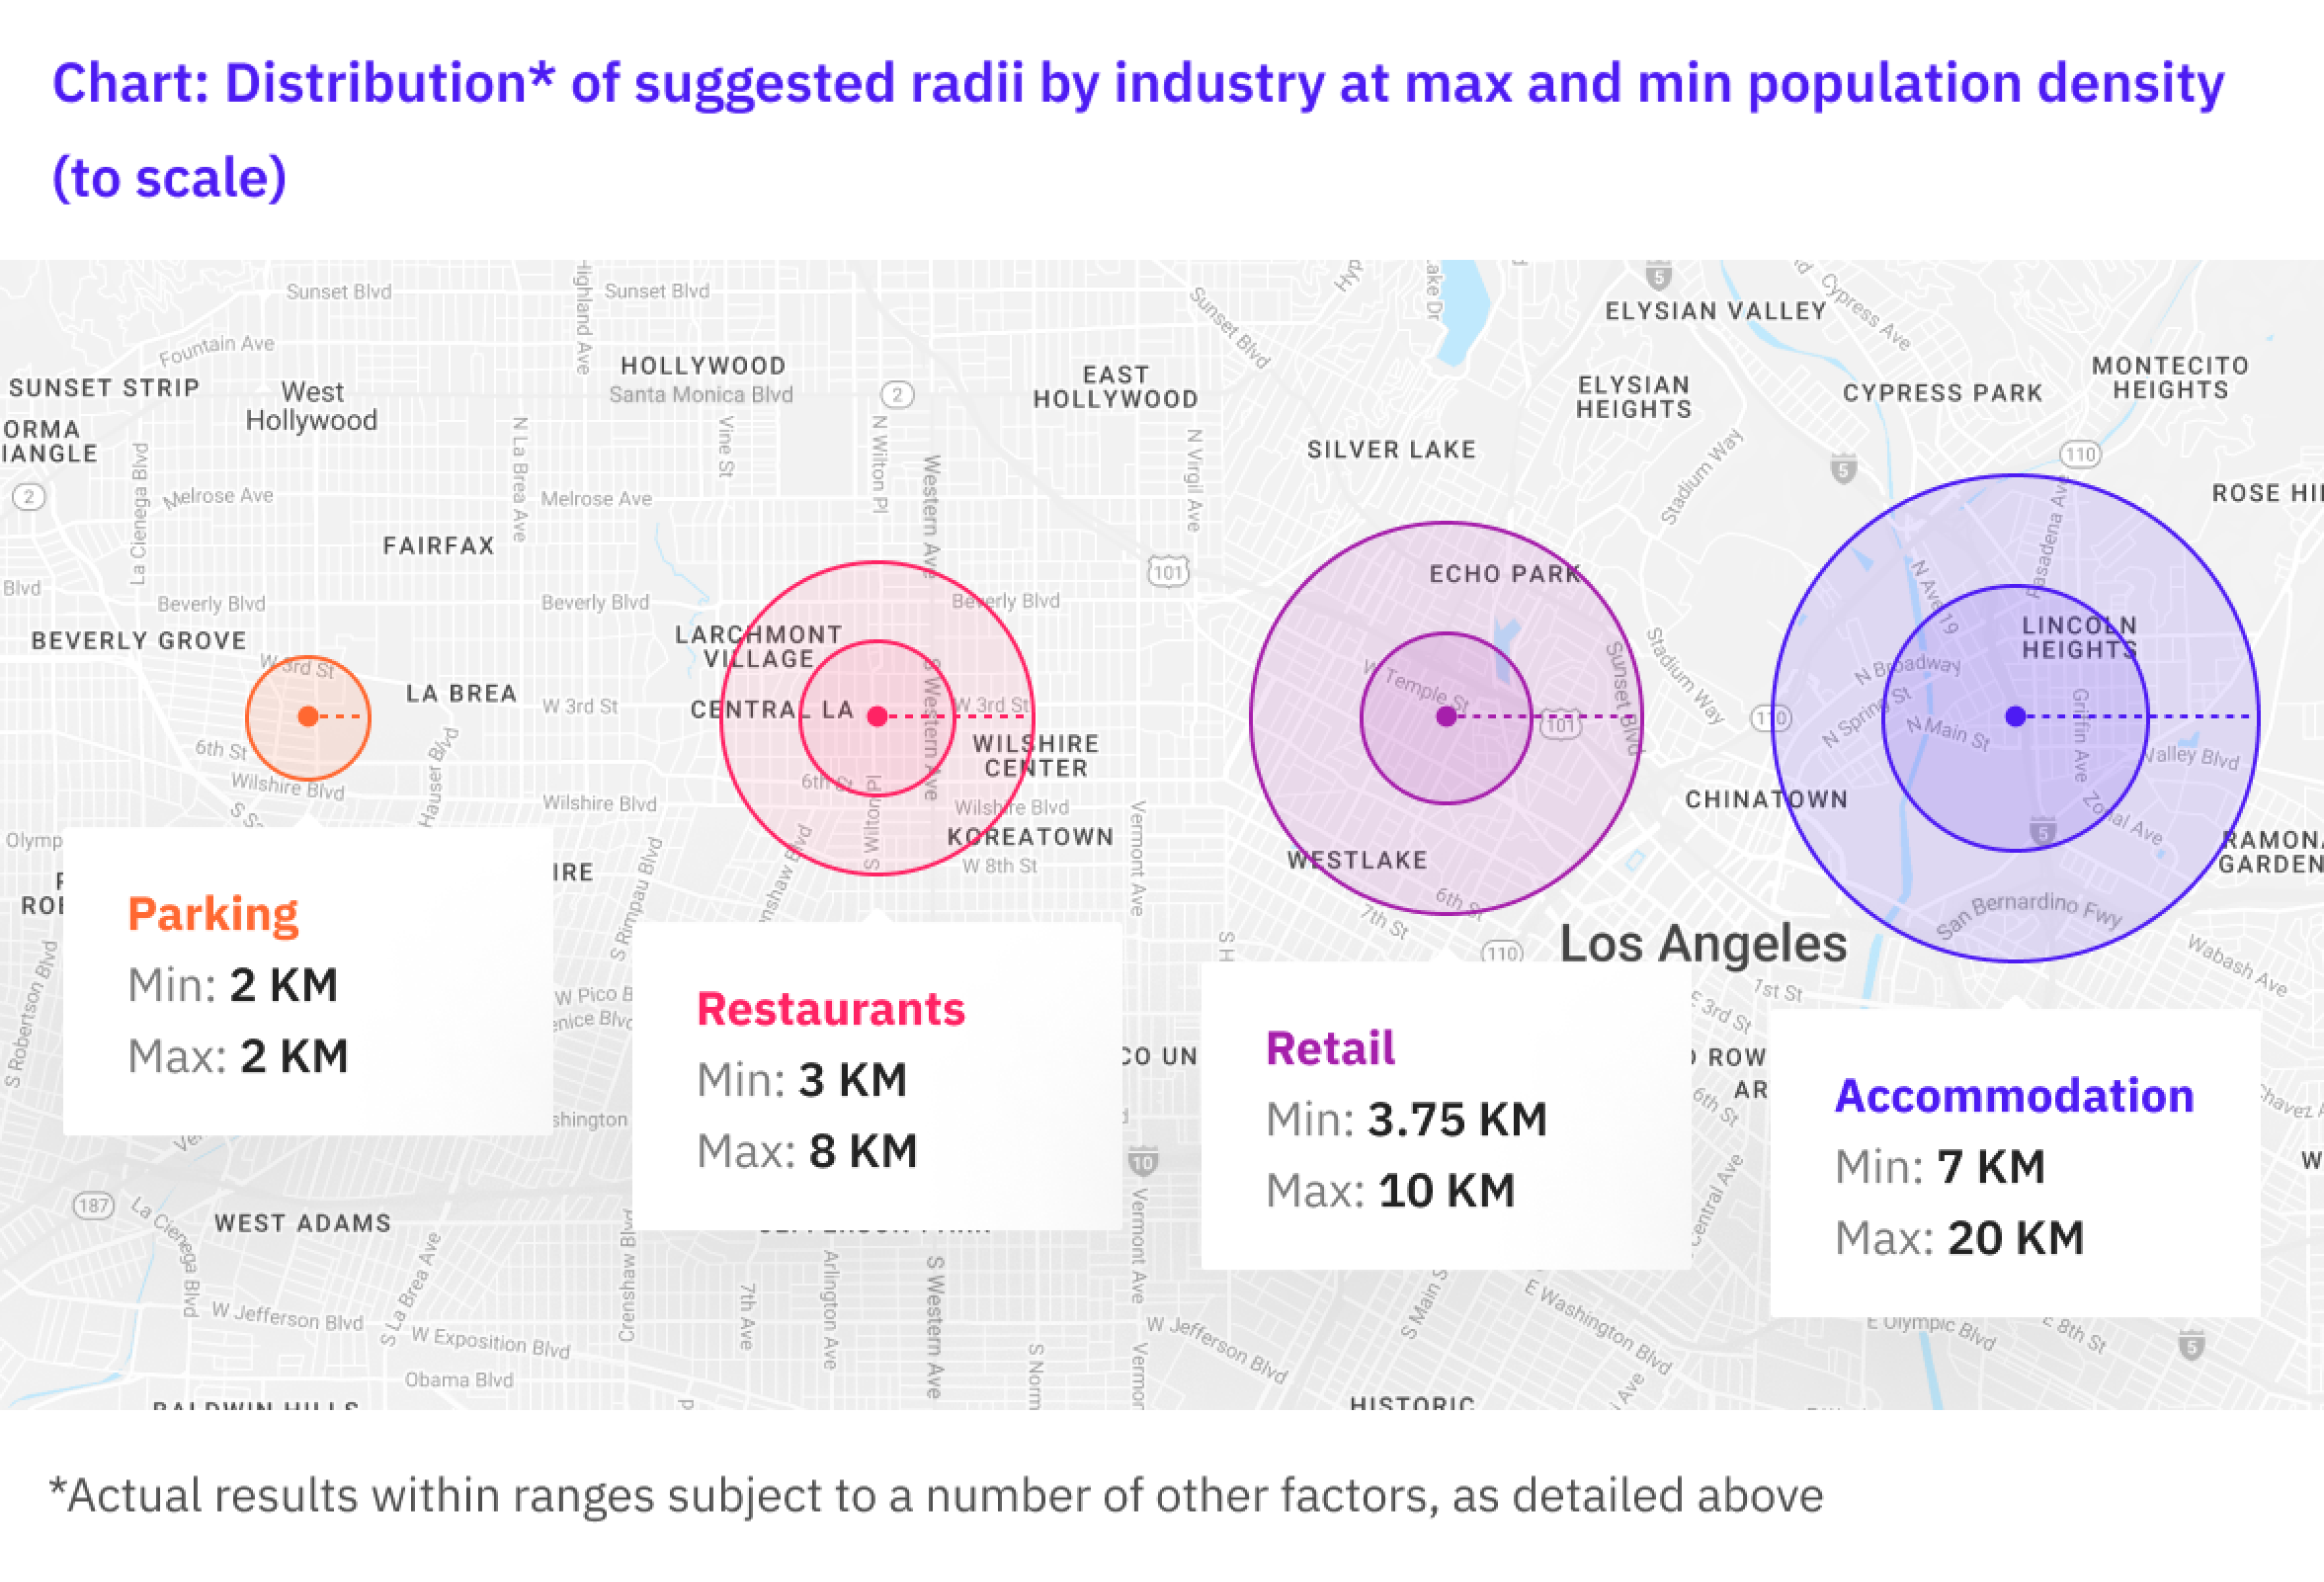
The Suggested Radius API returns a radius that can be used to find attended events around a given location. When looking for events around a store, a hotel, or another business location, one of the first questions that comes up is how far away from a venue or location should you look for events. For example, should you look for events within a half-mile, two miles, or ten? The Suggested Radius API is powered by a machine learning model that looks at factors like population density, the events around a location, the customer’s industry, and more to recommend the optimal search radius for you to capture relevant events near your location
To use the API, simply call the endpoint with the latitude and longitude of your location. Supply the industry and units (e.g. miles, kilometers, etc) for the radius, and it will return the suggested radius. Leverage the API Explorer to learn more about how the Suggested Radius API could be used to better filter for the events in close proximity to your locations.
Use the Demand Surge API to identify peak periods of demand in advance
With the Demand Surge API, you can identify dates with surges in demand caused by multiple events happening at the same time and location.
Use the Demand Surge API to quickly scan a period of 90 days for abnormal increases in attendance for a given area. The API calculates the mean attendance for your requested location across 90 days, then returns all the dates where attendance is a certain number of standard deviations over the mean. This is represented by the min_surge_intensity parameter, which corresponds to the number of standard deviations the API will look for.
We've also added more fields to our Events API and improved the overall user experience of the API Explorer. Get started and see how these enhancements can help you:
Anticipate demand surges and adjust staffing and inventory levels to maximize sales
Surface predictive demand intelligence in your own platform, powering deeper insights for your customers
Use insights powered by machine learning to inform your marketing strategies and promotions
Ready to unlock the power of our APIs?
Discover a wider range of APIs that can reveal demand trends and patterns in your data – so you can make operational or business decisions with confidence. Head over to the API Explorer today and see how these new functionalities can empower your business!


