Updates to Location Insights


Location Insights is a feature in our Web Application (Control Center), where you can easily add and track your locations of interest to identify future event impact most relevant to your business. In Q3 (July – September) 2022, we made several improvements to enhance and streamline your experience with this tool.
Need a refresher on the feature before you continue? Learn more here. If not, check out what’s been improved:
Updated suggested radius feature
An event's impact on your business will vary depending on the distance your location is from an event, and this will also vary by location. Within Location Insights, you can either enter a physical address for your location or you can enter in a city. For either, you need to supply a radius around that location.
We suggest a radius that is automatically populated into the radius field or you can select your own. We then show all events that will be happening within the selected radius. What is new is that we have improved the suggested radius functionality to give you better results.
Previously, the suggested radius feature just looked at population density and did not take into account if there were any events that fell within the radius. We've made an improvement so it also looks at events in the area. We start by looking at a radius based on the population density – but if it doesn't find any events in the radius, or if it only finds a small amount of events, it will increase the radius to a larger area.
For example: previously, the suggested radius for Sonoma in Northern California (population 11,082) would have been a radius of 4.8 miles– which resulted in 27 attended events and a predicted attendance across all of those events of 2,280 people. Now, the suggested radius for this same location would be 9.7 miles – returning 127 attended events with a predicted attendance of 65,135. For large cities with a high volume of events, the suggested radius will tend to be similar before and after this update. But for places with less events, the suggested radius will be a significant improvement.
Note: You can always change the radius field manually. If you want to replace the suggested radius and look at a bigger or smaller radius, then simply update the value in the field.
Access your saved locations in Control Center search
We've updated our Control Center search to include the ability to search on locations that we’ve uploaded into the Location Insights tool. You will be able to access these results within the Control Center search view. We have also made the following additional improvements:
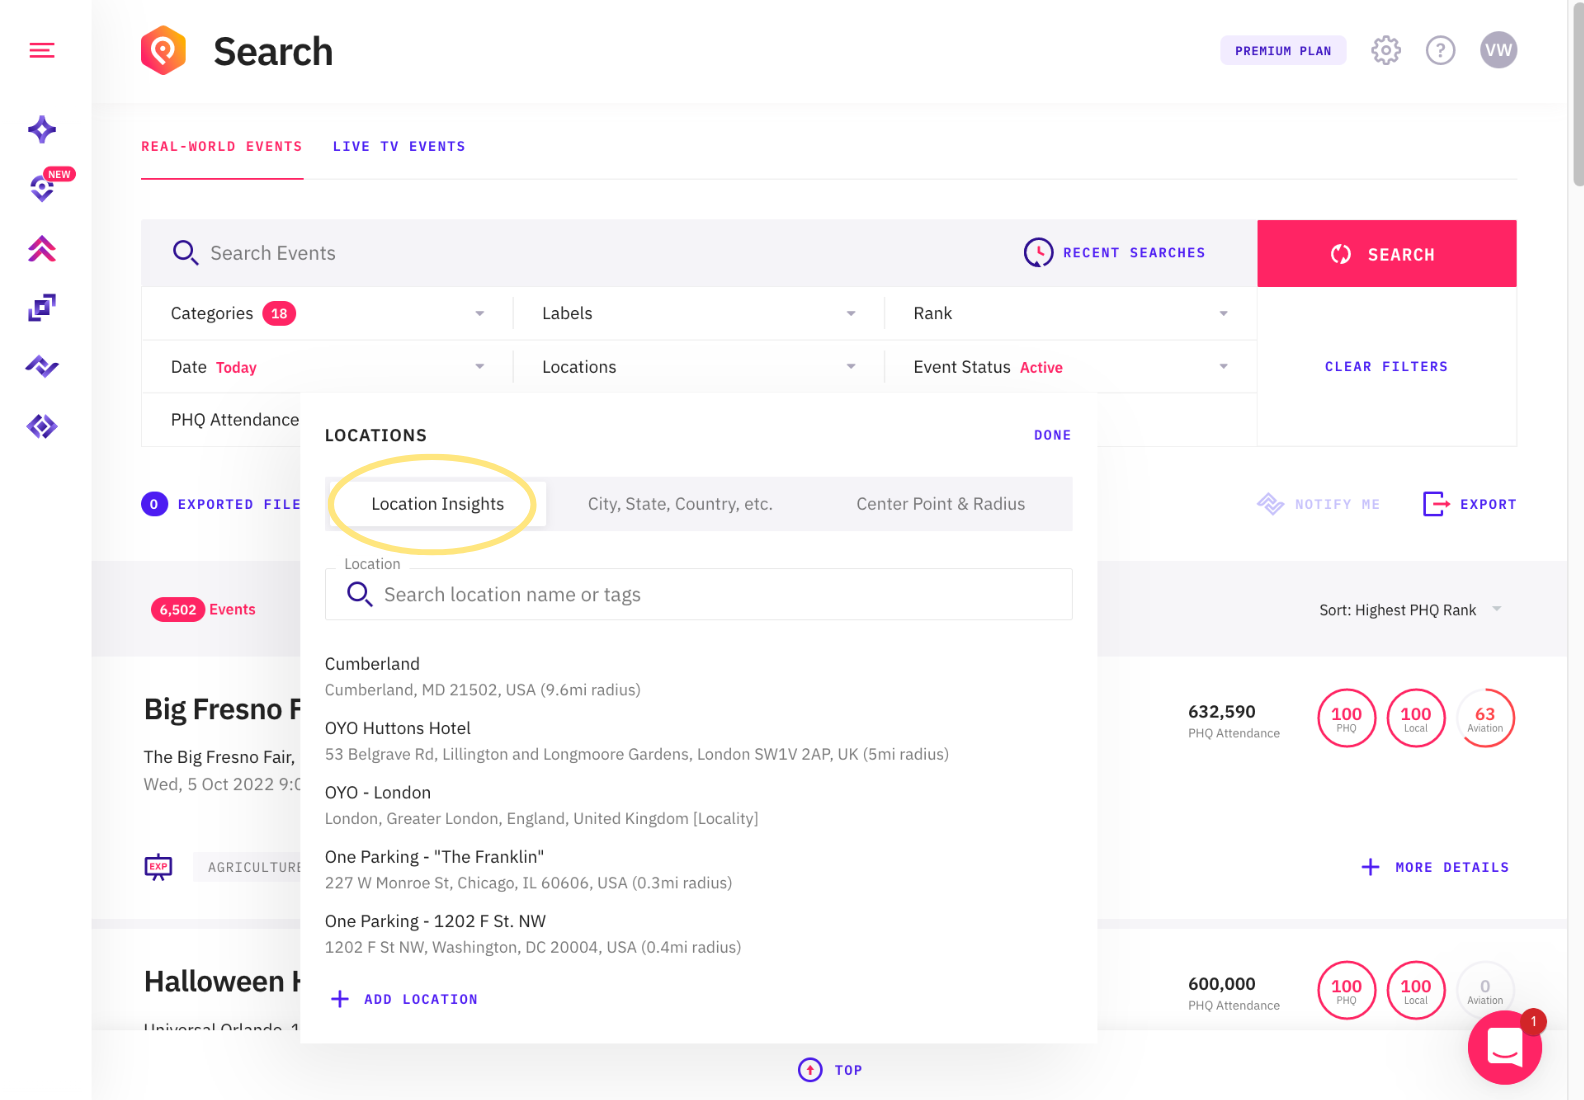
Location Insights tab
You can search your saved locations in the new Location Insights tab and select a location to search. The normal Location Insights search options of searching on name, address and tags work here.
City, State, Country tab
The previous search functionality is now called "City, State, Country, etc." and is in the second tab. This is the pre-existing Control Center search functionality which reflects that you are searching for events in an entire geographic area, such as an entire city, state, or country.
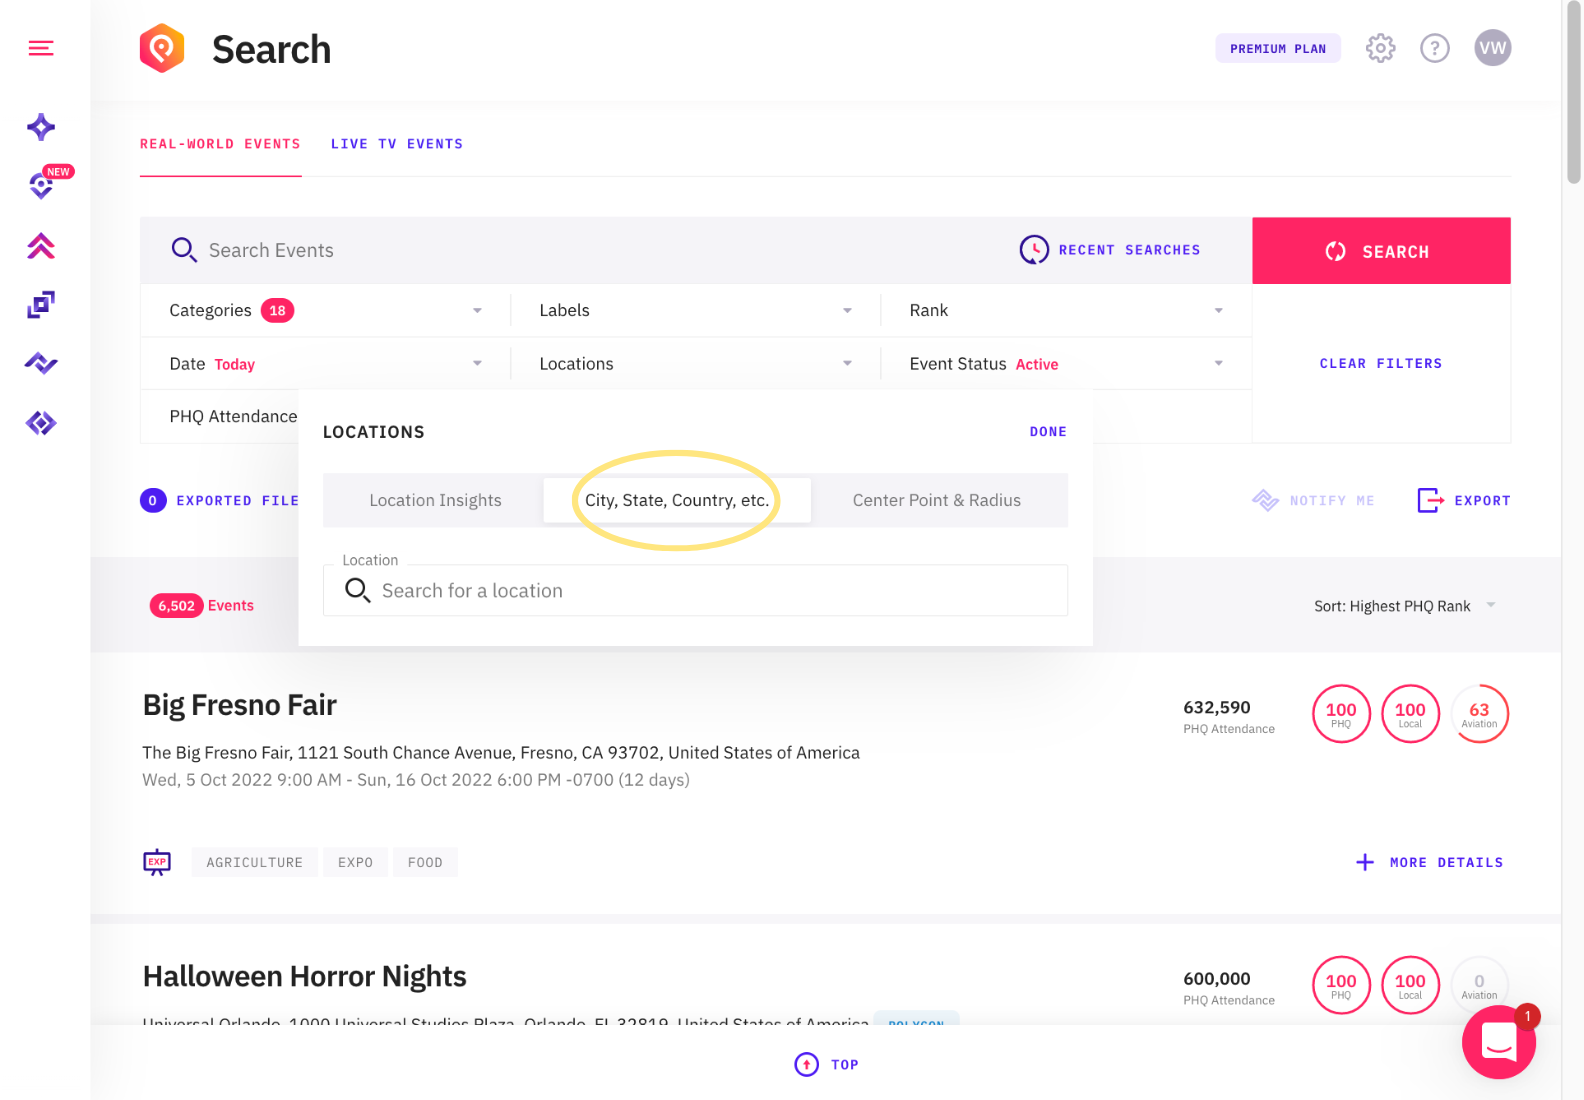
Note that you can also create a city, state and country location with Location Insights too (it is not just limited to physical street addresses). If you are often searching for the same location then we’d suggest creating a saved location for it. That saves you from having to enter the details over and over again.
Center Point & Radius
We have moved the within field inside the locations section within search. It's located in the third tab, called "Center Point & Radius". We moved it because this creates an additional option for setting your location. This option allows you to enter a lat/long and radius to use as your search area to find events. This means you’ll have the choice between one of the three options to search for a location.
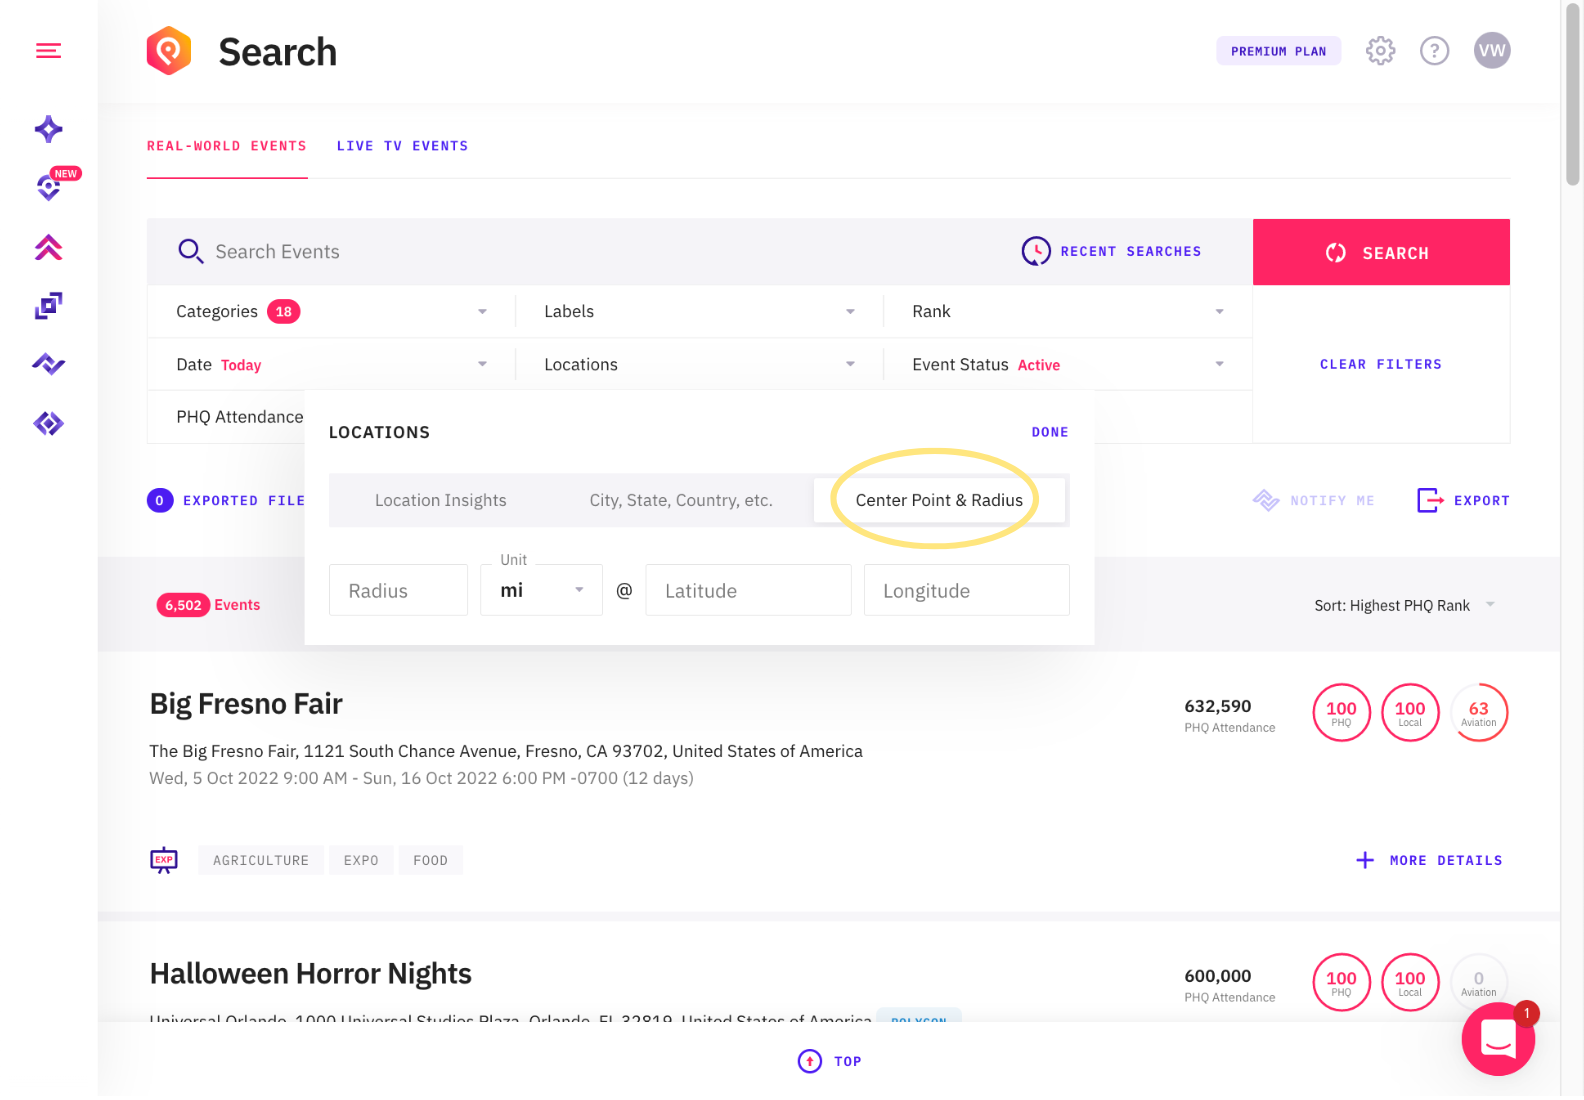
We have also fixed an issue so you can now enter decimal amounts like 1.5 or 0.3 into this field versus being confined to whole numbers. You can do this type of search from within Location Insights by choosing a Center Point & Radius location.
Use this option if you want to paste in a latitude and longitude for a one-off search. Using the Center Point & Radius option in the control reflects how the API is called. The values you enter into Center Point & Radius are passed to the within parameter in the events API. For most uses, we’d suggest creating a street address location within Location Insights. If you want to add a latitude and longitude as the street address, you can save the location for future use.
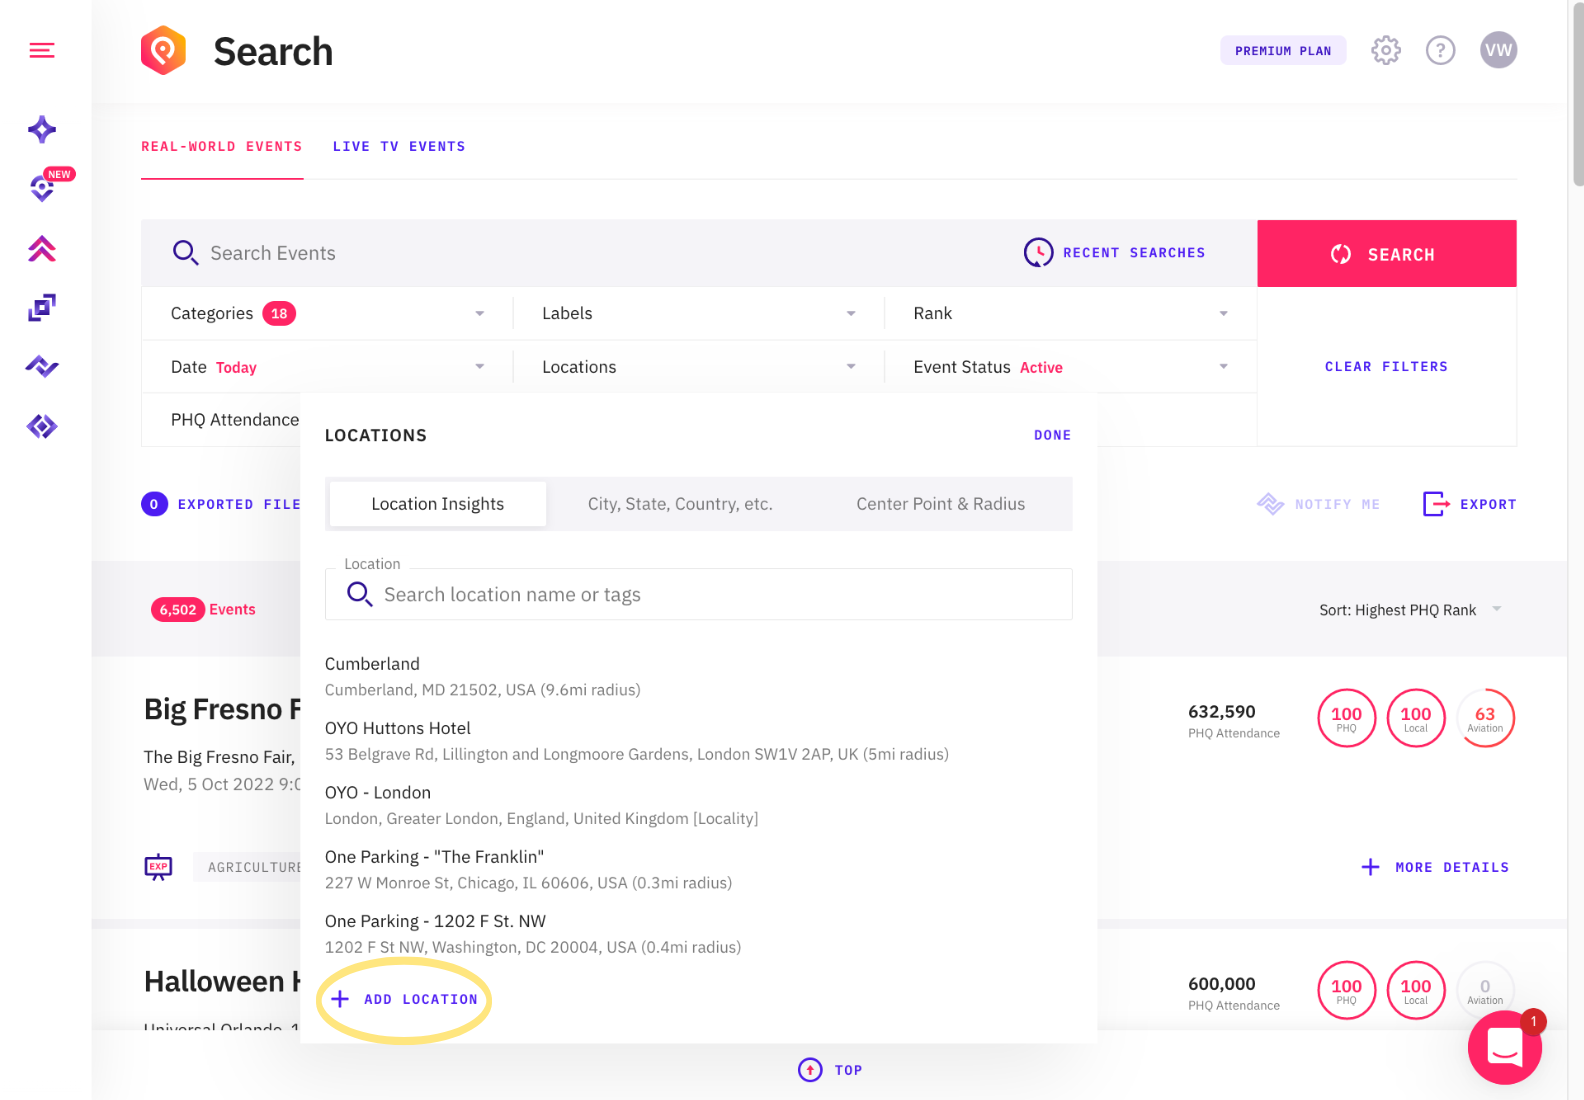
Plus, there is now also an add option at the bottom of the list of locations to allow you to add a new location directly from within the locations tab in search.
We have made these changes to make Location Insights easier to use and to ensure the language is consistent between the Location Insights feature and Control Center.
Daily event impact now supports Location Insights
The daily event impact features allows you to see the total impact of all attended events in a location per day. This feature allows you to see demand surges (spikes in demand) and demand decreases. This can help you plan for upcoming fluctuations in demand.
We've updated the Daily Event Impact page in Control Center so that you can choose locations that you’ve added into Location Insights and see the daily event impact for those locations from within the same screen.
Users on the free plan can choose to see insights and upcoming events around 3 locations, for free. Users on other plans can use other options, including many more locations and access to events at the city, state, and country level. . Using the same control for locations allows us to provide a consistent user experience across PredictHQ features.
Tooltips for Location Insights stats
To make Location Insights more intuitive, it now features mouse over tooltips for the 90-day statistics included in the Location Insights list view. Now, when you mouse over Predicted Attendance, Attended Events, Non-Attended Events, and Unscheduled Events, you’ll see explanations for each of the fields. The tooltips can be seen in our Location Insights list view in the dashboard, or the Location Insights list.
Have you added your locations yet? Sign up for a free account or log in today to unlock impactful events around your locations of interest.


