Predict how events will shape consumer behavior with Demand Impact Patterns


Use Demand Impact Patterns to anticipate how events will shape consumer behavior
Ever witnessed the eerie sight of empty grocery shelves before a storm? With consumers faced with the possibility of being homebound for days, retail and grocery demand often explodes in the lead-up to severe weather events – leaving shelves bare of essential items such as bottled water, fresh produce, and even canned goods.
When preparing for potential changes in demand, it is crucial to consider that the demand pattern won't be as straightforward as a hurricane predicted for a specific day, which would naturally result in lower demand on that day. For example, demand may be expected to drop on a Tuesday due to a storm, but savvy retail forecasters will factor in the broader impact on customer behavior. This is because in reality, many events result in a much more dynamic demand pattern including pre-event surges, event-day dips, and post-event fluctuations before normalcy resumes.
PredictHQ’s Demand Impact Patterns solve for this exact scenario. The feature accurately predicts how severe weather events impact local businesses before they start and after they end. This has been widely used across our customer base, which has led us to extend the event categories that the feature covers. Demand Impact Patterns has now been extended to attendance-based event categories and the accommodation and hospitality industries!
This update makes it easier for you to better anticipate and plan for fluctuations in demand associated with various event types by flagging leading and lagging days, defined as the days before and after an event actually occurs. Our demand intelligence platform now extends and adjusts an event’s attendance across these leading and lagging days – resulting in a realistic portrayal of increased demand leading up to these events, and a gradual tapering off once they conclude.
Let’s take a closer look at the updates to this feature that provides unique, data-driven insights and demonstrates the true impact of events. Specifically, we’ll be focusing on two sectors that are expected to be impacted the most by this coverage extension: the accommodation and hospitality sectors.
Attended events impact demand before and after they take place
Severe weather is far from the only event category which has a leading and lagging impact on local business demand. For example, ticket holders for a large concert may arrive in town several days before the show, resulting in increased demand for local hotels and restaurants.
By leveraging Demand Impact Patterns, you can accurately predict and prepare your business for the influx of attendees well before they even arrive in town – and after the event, you can adjust your strategies to sustain the increased demand.
The graphs below demonstrate an example of Demand Impact Patterns on accommodation and on hospitality, highlighting the influence of events on demand trends:
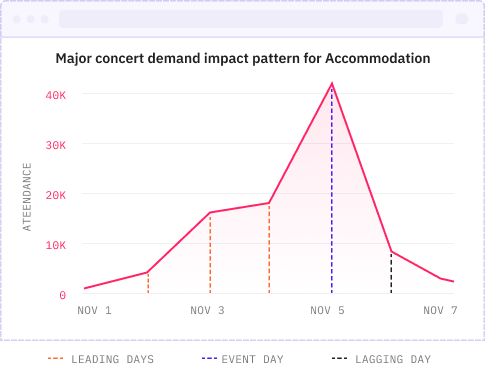

“Leading Days” shows the impact before the event
“Event-day” shows the impact on the day(s) of the event
“Lagging Days” shows the impact after the event
Extended Demand Impact Patterns coverage
Demand Impact Patterns are now available for the following industries:
Accommodation
Hospitality (Food and Beverage)
Across the following attended categories:
Concerts
Sports
Festivals
Conferences
Expos
Performing arts
Community
These categories are on top of the already covered Severe Weather category.
PredictHQ APIs also updated with Demand Impact Patterns
The Events API now includes Demand Impact Patterns metrics for individual events for the supported categories (in the impact_patterns field in the API response). The Features API has also been enriched with 14 new Demand Impact Pattern-related features, such as:
phq_attendance_concerts_accommodation
phq_attendance_concerts_hospitality
Use Demand Impact Patterns to boost demand forecasting accuracy
Our tests using real industry data have shown that integrating Demand Impact Patterns into forecasting models results in a notable increase in accuracy, with a 2.2% absolute improvement in MAPE (Mean Absolute Percentage Error) for accommodation businesses compared to forecasts using features without Demand Impact Patterns.
For more detailed information on how to use Demand Impact Patterns, refer to the Impact Patterns section of our technical documentation.


