PredictHQ Quarterly Release – January 2024


Welcome to our January 2024 Quarterly Product Release! Every three months, PredictHQ pulls together the latest product and feature announcements to ensure you’re getting the most value out of our platform. You can find previous releases on our Resources page.
We're kicking off 2024 with two new updates including:
Identify Event Trends in seconds
Predict how events will shape consumer behavior with Demand Impact Patterns
Watch the on-demand webinar where PredictHQ’s Director of Customer Success JJ Mills walks through each of these new releases and shares how to use them to get the most out of our data. For now, let’s take a closer look at the additional product updates for this quarter.
Additional Product Updates
Explore six more releases including an update to our Python SDK, improved predicted attendance, Predicted Event Spend now available in Saved Locations, and more:
1. Update to the PredictHQ Python SDK
Version 3.0.0 of our PHQ SDK is here! Our PHQ SDK now works seamlessly with newer versions of Python, meaning no more hassle of installing an older version just to use our SDK.
The library now supports Python 3.10+ and we’ve dropped support for python 3.6. These updates had to come with a few breaking changes that are detailed here and they are mentioned on the Github repo’s here.
2. Changes to Control Center navigation
We’ve made some updates to the look and experience of our web application navigation to make it more user-friendly.
The left navigation menu will now be open by default, so it's easier for you to find what you need. You can still collapse it if you prefer a compact view. We've also revamped the icons and labels to make navigation a breeze. Now you can effortlessly explore every nook and cranny of our web application, even if it’s your first time!
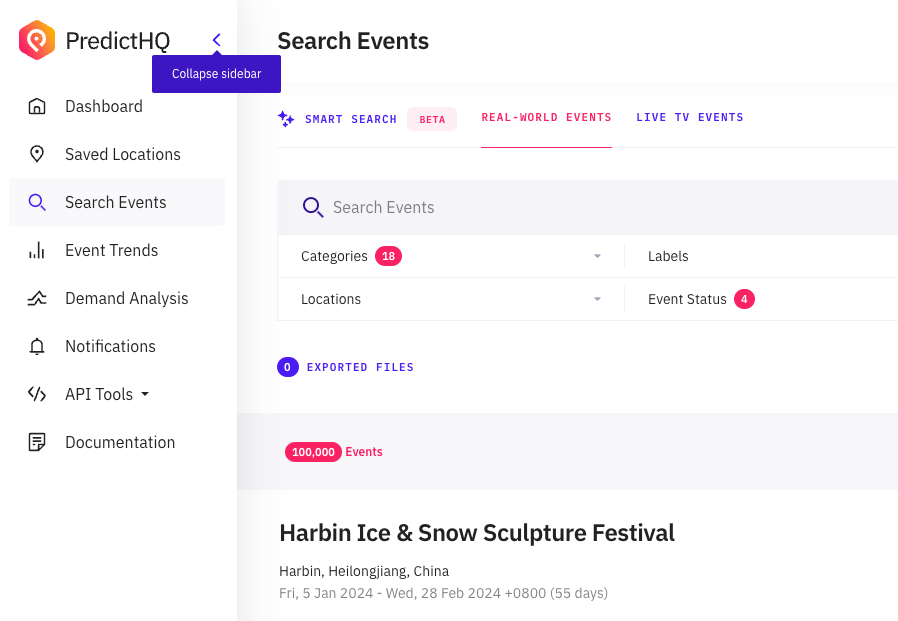
We’ve also changed the names of the features for simplicity:
Location Insights is now Saved Locations
Daily Event Impact is now Event Trends
Beam is now Demand Analysis
Lastly, we now have a documentation link in Control Center that takes you to our technical documentation. This way, you never miss out on any relevant information again.
3. Better coverage for attended events
Often people focus on really big events from the Super Bowl to Burning Man where the impact is expected to be large. But the smaller events matter, too. We have extended our coverage to include even more smaller events including better coverage for smaller towns and rural locations as well as smaller events in cities.
We have implemented a new provider that sources events for us in 150 smaller cities and towns throughout the US to cover future attended events – so you can more easily tap into the potential of smaller towns and cities. This update increases the coverage of attended events with under 1,000 attendees, which often still have an impact on business demand and local spending.
Previously, these 150 locations provided coverage for around 8,000 future events. This update adds an additional 10,000+ events to these locations in the future. Over the course of January and February 2024, we're planning to roll out this change across the US. This increase in coverage of smaller events will ensure you are even more prepared for impacts on demand from events.
Examples of new events now captured that we previously didn’t have include:
4. Improved Predicted Attendance accuracy for conferences
At PredictHQ we are constantly working on improving the quality and accuracy of our data. We predict attendance for events in advance of them occurring. We use data from many different sources as well as using advanced machine learning models to predict how many people will attend events and we regularly update our models and add new models to improve the accuracy of our data.
Previously, for a portion of our conference events, we estimated attendance using round numbers (like 1,000, 5,000, or 20,000) which were the attendance figures provided by various data providers. This approach didn’t provide the most accurate attendance figures for conferences.
Because this data is not available from any other source, we’ve now built a new machine learning model to target these events specifically, and to more accurately predict attendance for about 55,000 future and past conferences.
This new model will notably enhance the accuracy of our attendance predictions across the conference category globally. Below are three examples of enhanced attendance accuracy after implementing this new model. Previously the data available for other sources for these conferences showed them at a much higher attendance. Here are examples of the updated predicted attendance figures for three smaller conferences:
Animal Care and Handling Conference: 279 attendees
International Conference on Language, Literature and Culture: 417 attendees
Dallas Cybersecurity Conference: 468 attendees
5. Improvements to Predicted Attendance for events outside the US
Similar to the update above, we’ve also made further quality improvements related to our predicted attendance feature. We have a number of attendance-based events from outside the US where no attendance data was available from any source and that were not ranked by our current predicted attendance/ranking models. This resulted in empty data points for PredictHQ rank and predicted attendance, making them unusable in forecasting models because they lack key information about how impactful an event will be on a business.
The machine learning (ML) models that predict how many people will attend smaller events were previously only capable of ranking events in the US. We have extended these models to rank international events outside of the US. As a result, we have now ranked and predicted attendance for 254,000+ conferences, performing arts, and community events which previously had no rank. In other words, it’s as if we’ve just added 254k new events into our system!
While over 90% of these events are future-facing events, this release also ensures that all new smaller international events that we ingest into our system will now be ranked and have accurate predicted attendance figures.
Below are examples of events which previously didn’t have a rank or attendance, that have now been optimized across three event categories:
Community:
Family Arts Festival 2023 by Tramshed in the UK
Jester's Tears and CRAZY69 in Germany
LIPSTICK - N - DYNAMITE in the US
Performing arts:
The Gentleman Magician's Magical Soirée in Australia
Conferences:
Quartet - A Talk by Leah Broad in the UK
Future Science Talks Sydney in Australia
Future of Retail Marketing Conference 2023 in Aotearoa
6. Get a 90-day overview of event-based spending in the locations that matter to you
Predicted Event Spend has been added to Saved Locations statistics in our web application. It now shows the combined Predicted Event Spend for the next 90 days for each location as part of the stats at the top of a Saved Locations page:
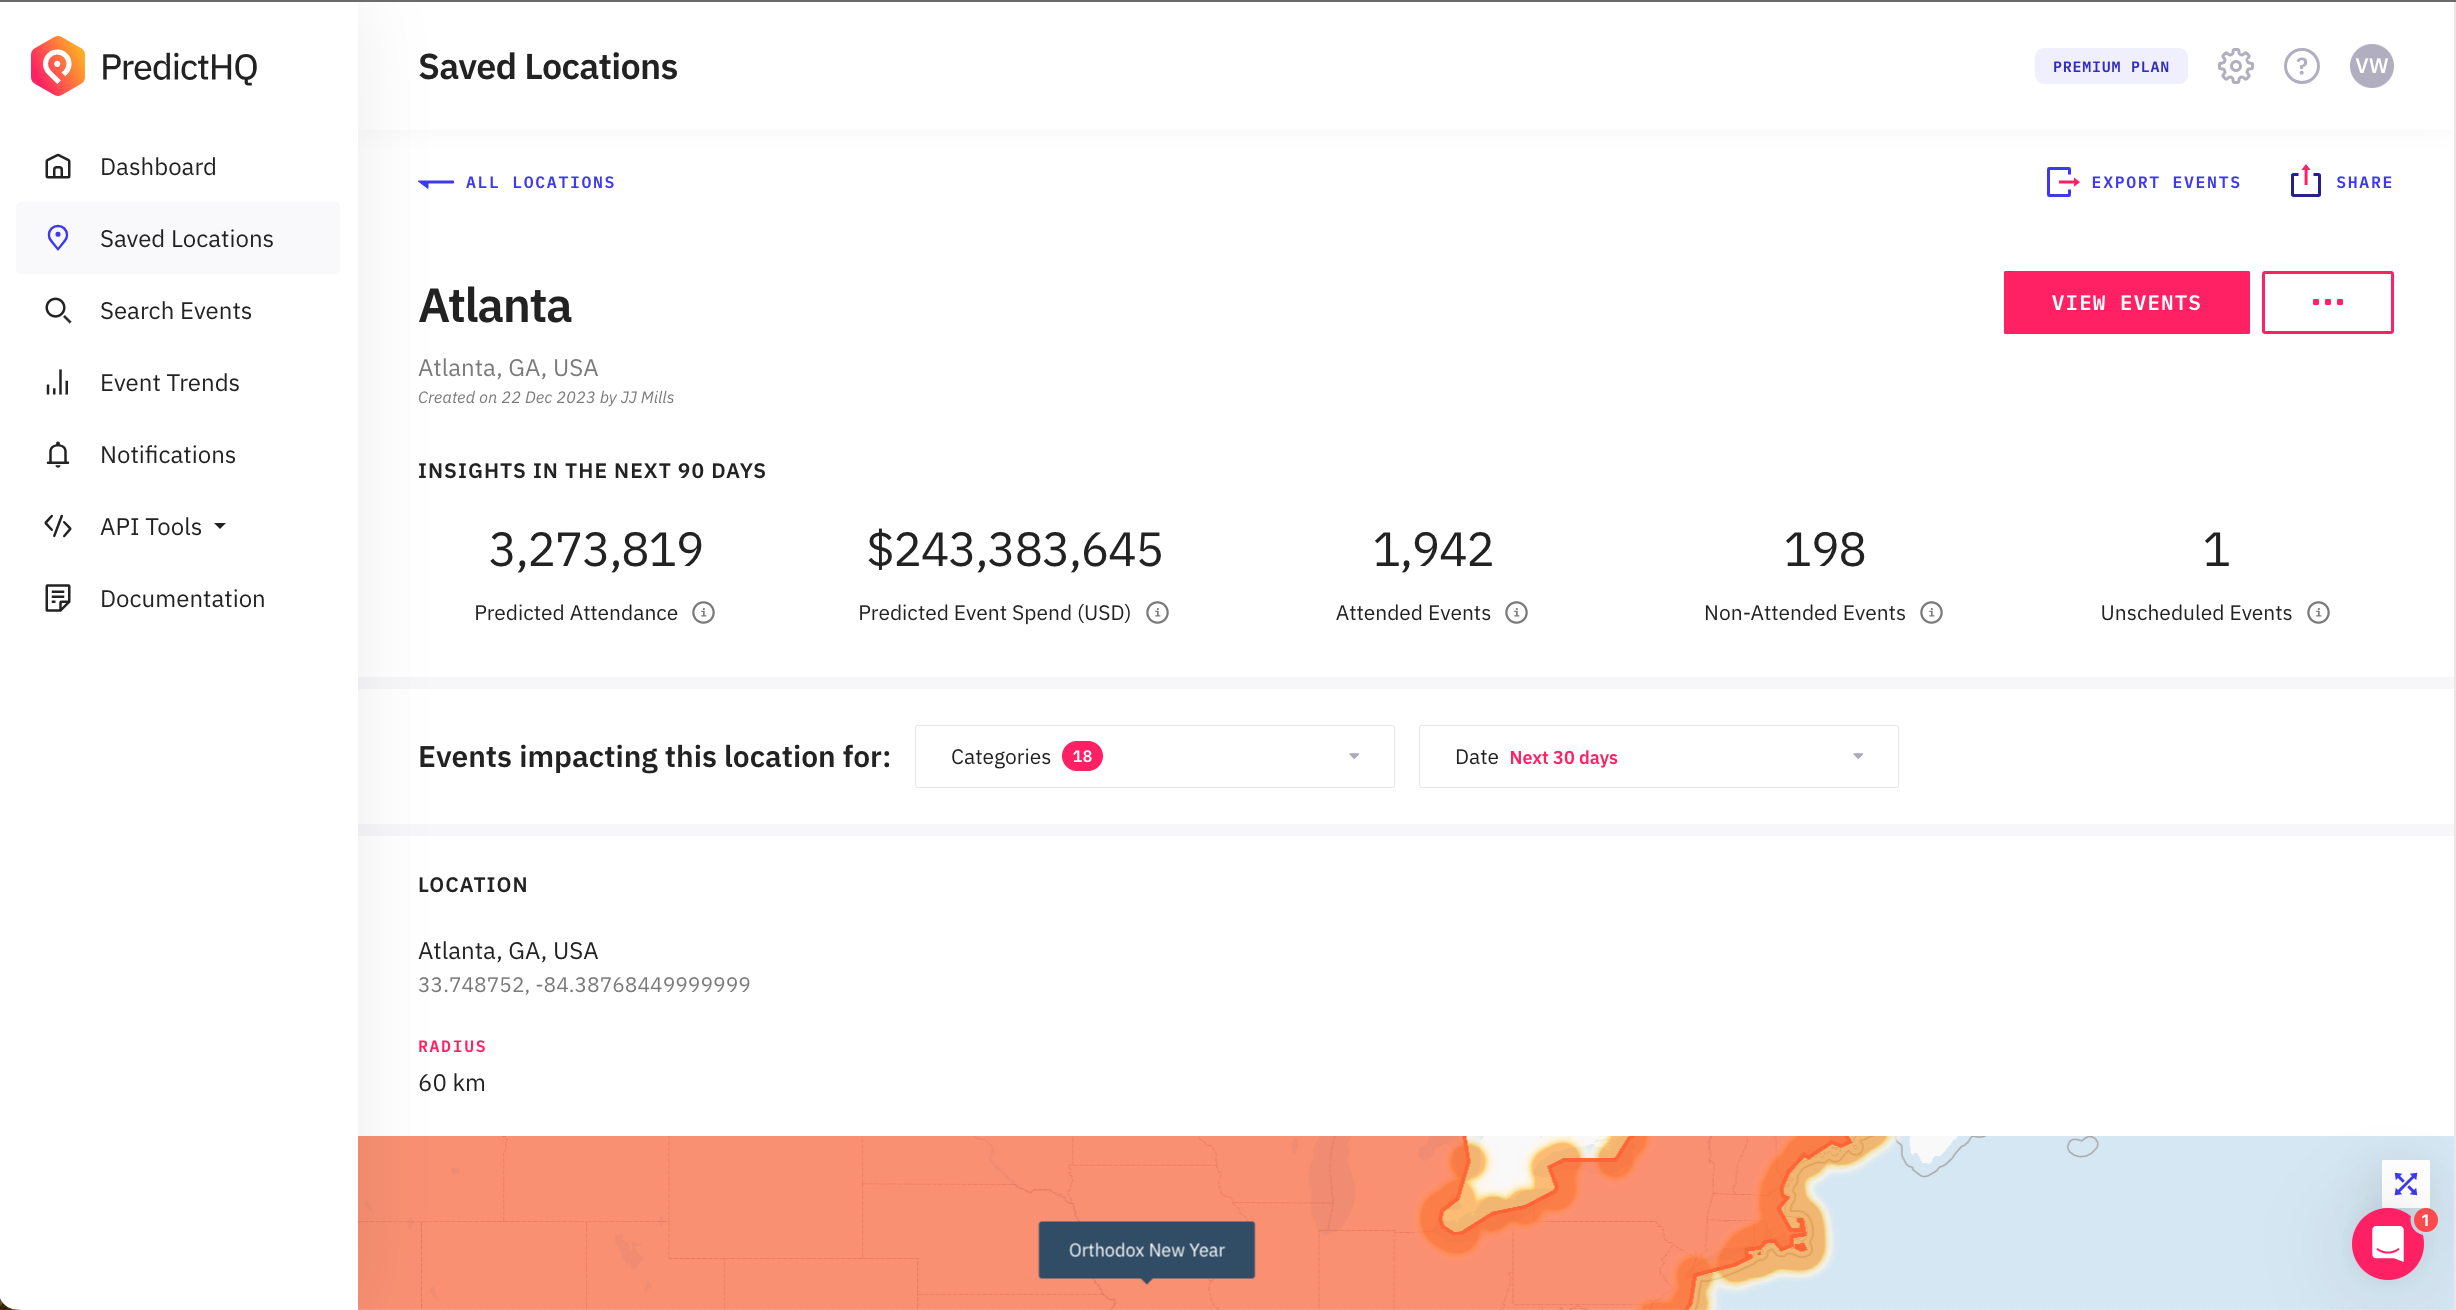
When you look at the list of events per location shown below the map for saved locations you can see how they contribute to the total predicted event spend.
You can also see the total Predicted Event Spend in your list of Saved Locations as a new column as shown below. This allows you to compare the spend at different locations.
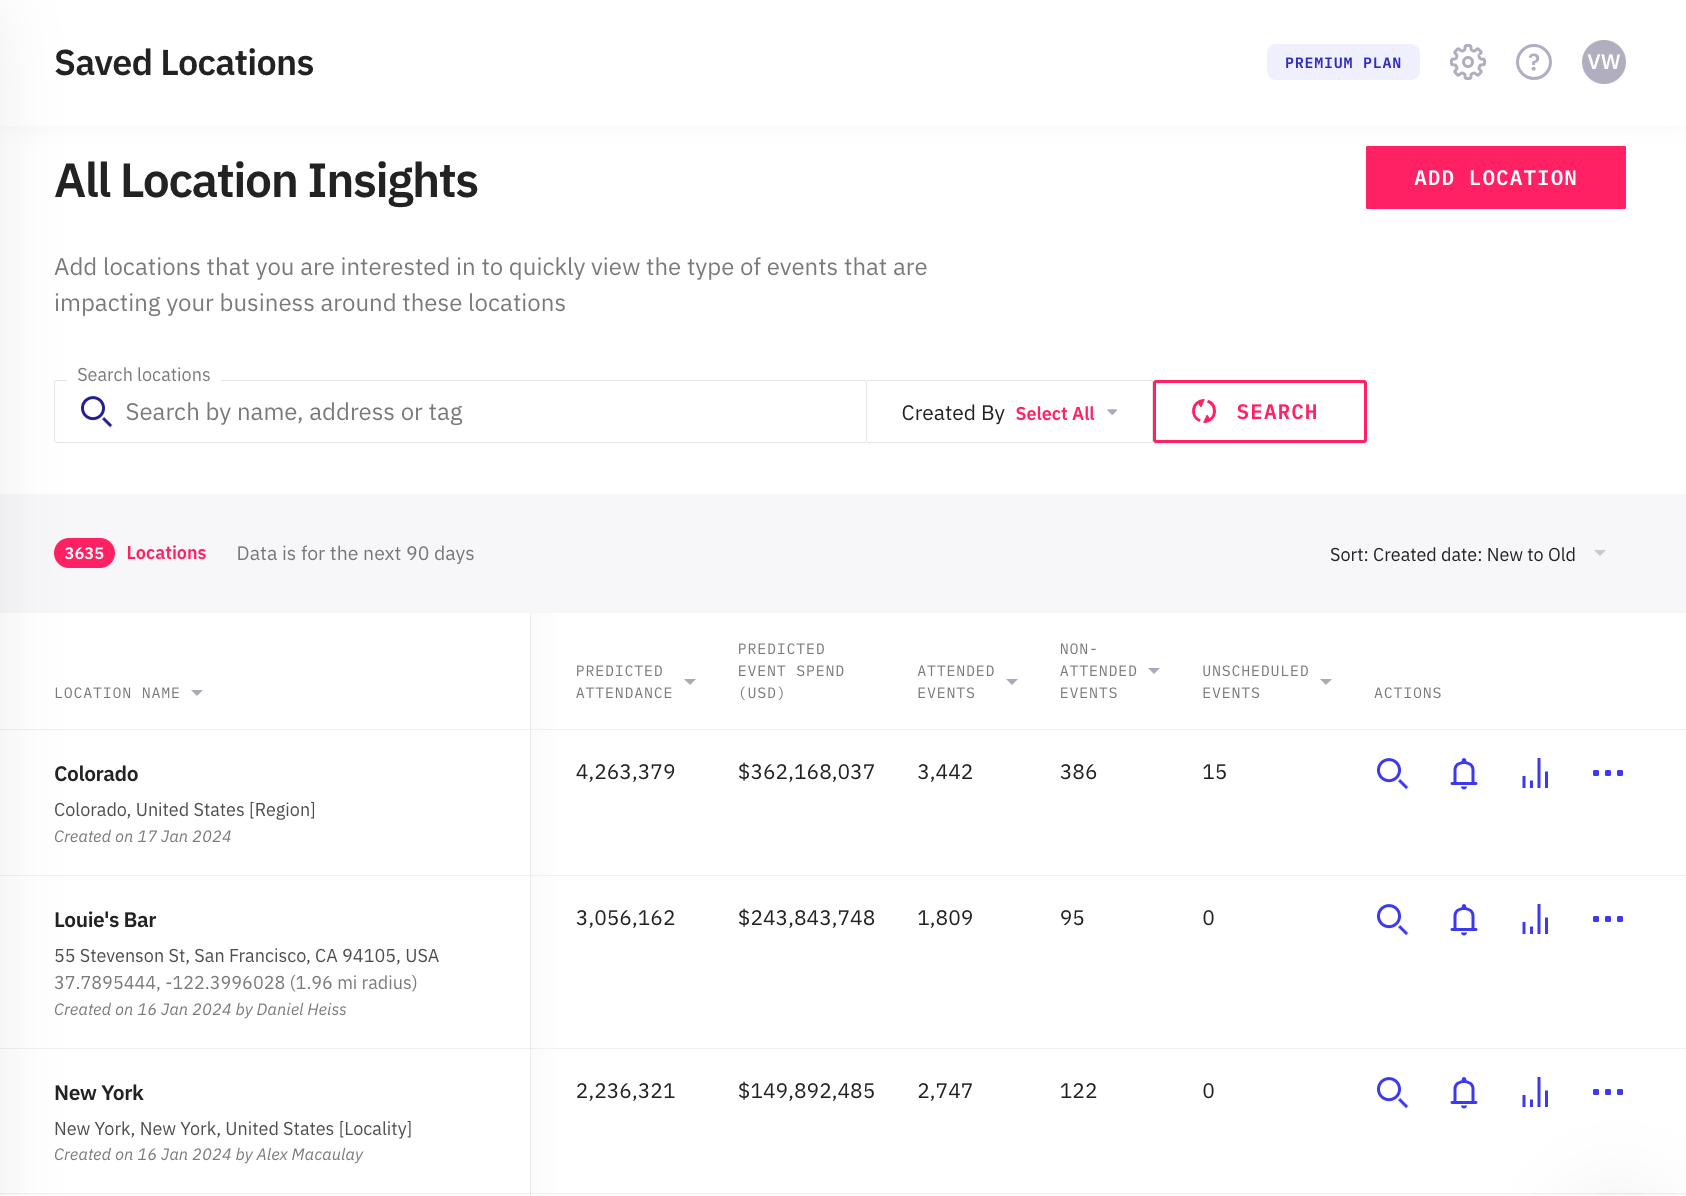
Predicted Event Spend data is also available in our Saved Locations API and the Location Insights public share pages. These changes make it easier to understand event-based spending trends at a glance, so you and your team can be aware of upcoming spending surges well in advance.
You can also see aggregated Predicted Event Spend data in Event Trends. This is useful if you want to look at event-based spending for date ranges other than 90 days. You can also dive deeper and see the predicted attendance and Predicted Event Spend per category and per industry and see upcoming spikes and dips in spend.
Use Predicted Event Spend as another data point to look at the impact of events on a location. This can help you decide on what actions to take around a location such as making decisions on pricing, staffing, inventory, or other business actions.
Log in now to explore event-based spending trends for your locations of interest.
Dig deeper into these updates in our January 2024 Quarterly Product Release Webinar, available for you to catch up on anytime. We also encourage you to try the new features out to see how they may improve your workflow or the way you use PredictHQ.


