Demand Intelligence in Tableau

Quickly visualising and informing your teams of the impact of events no matter where they occur in the world is simple with this frictionless feature. Connect and explore our intelligent real-world event data in Tableau — no code necessary.

  • Intelligent and accessible

    Intelligent and accessible

    It is impossible to identify demand anomalies without accurate data. Visualize our intelligent event data easily in Tableau to get started quickly.

  • Expansive Global Coverage

    Expansive Global Coverage

    PredictHQ is the single source of truth with coverage across 18 different categories and global event data coverage from 100+ sources.

  • Clean Event Data

    Clean Event Data

    Data Scientists spend about 40% of their time gathering and cleaning data and only 11% of time on data science. We remove the trivial work, so you can focus on what matters.

Step One

Sign Up + Create Access Token

Log in to your PredictHQ account or sign up if you don’t have an account. In the API Clients section of Control Center, select the "+" button. Give the API Client a title and description. Next, select "Create an access token". Select the scopes "Account", "Events" and "Places".
Step Two

Open Tableau + Enter Access Token

In Tableau, select Web Data Connector and enter the URL: https://tableau-connector.predicthq.com . Click on Begin, enter the token you generated in Step 1, and hit OK.
Step Three

Select Filters + Get Your Data

Choose the filters and parameters that you wish to explore. Check out PredictHQ’s Developer Docs for a full list of properties and parameters. Lastly, click "Get data" which will load the rows directly into Tableau for you. Now you're ready to explore PredictHQ’s intelligent event data through Tableau.

Create a new access token via API clients

All API features

PredictHQ's Demand Intelligence API features were built to expedite your forecasting and unlock revenue opportunities for your business.
  • Radial search
  • NLP Labels
  • PHQ End Times
  • Geocoded Events
  • Umbrella Events
  • PHQ Attendance
  • Location search parameters
  • Recurring Events
  • Directional Flow
  • Geographical place scope

Customer Stories

Demand intelligence gets results

PredictHQ's customers include top companies from a variety of industries, including accommodation, transport, and retail. They're using our intelligent event data for labor optimization, dynamic pricing, demand forecasting, supply chain optimization and more.
Don't underestimate how much effort it takes to work with event data... Being able to rely on a company whose sole purpose is to remove the ambiguity of event data has been game-changing for us.
Read Legion’s Story

Only pay for the locations you need

Unlimited users, unlimited future visibility, starting for just $75 per month

Free

Access to 3 business locations with maximum 5 miles radius only

$0

USD

/month

No credit card required

  • 14 Days Full Access
  • Web Application: Yes
  • APIs: None
  • Future Visibility: 3 months
  • Historic Visibility: None
  • Location Insights: 3 locations only
  • Location Type: Radius only
  • Radius: Up to 5 miles only
  • Event notifications

Lite

Access to entire cities of your choice

Starts from

$75

USD

/month

billed at $900 USD/year

View pricing details
  • Web Application: Yes
  • APIs: All
  • Future Visibility: Unlimited
  • Historic Visibility: None
  • Location Insights: Unlimited
  • Location Type: All
  • Radius: Maximum
  • Event Notifications
  • Access to entire cities
  • Unlimited # of users

Premium

Access to unlimited areas from cities to countries or even global access

custom

Contact us for pricing

  • Everything from the "Lite" plan
  • Event Categories: Up to all 19
  • APIs: All
  • Future Visibility: Up to maximum
  • Historic visibility: Up to maximum
  • Location Insights: Unlimited
  • Snowflake Integration
  • ADX Integration
  • Tableau Integration + more
  • Access to cities, regions, countries
  • Unlimited # of users

You can’t prepare for what you don’t see coming

Harness the power of demand intelligence

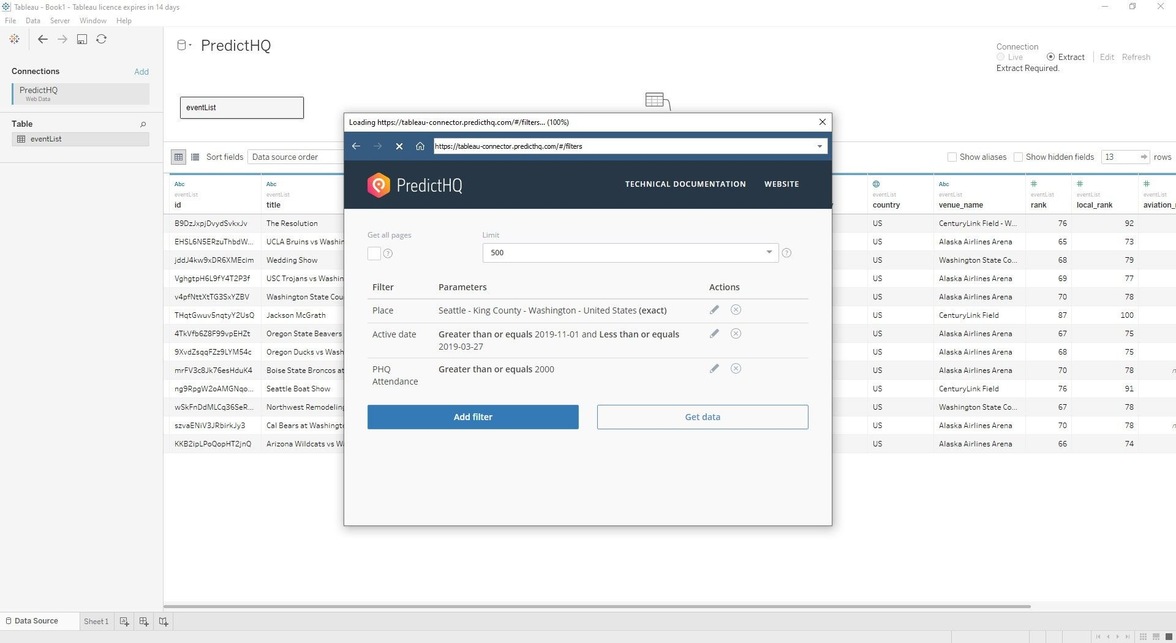
Knowing the impact of demand causal factors like events will transform your business. The American Society of Hematology has a $45M estimated economic impact — and that's only one event in one city.

  • 0
    data points enriching
  • 0
    events across
  • 0
    cities, accessed via
    1 API

Get Started

Contact our data science experts to find out the best solutions for your business. We'll get back to you within 1 business day.

Talk to an Expert