How metadata powers actionable business insights


Metadata provides context for data-driven decisions
It takes more than knowledge of impactful events to paint a complete picture of demand. Well-structured metadata is what transforms ambiguous, broad data into actionable, relevant business insights. The single most important word you can use in the context of metadata is relevancy.
For example, you might find an event on a ticketing API and assume it's happening at a certain time; and based on ticket sales, expect a certain amount of people to attend. A simple list of all concerts happening this week in London can only provide so much insight. You need metadata to understand the details around these concerts, such as:
Expected number of attendees
Start and end times
Geolocation
Venue information
These metadata points enable businesses to filter through the noise to best understand which of the concerts to focus on.
These details are important to businesses that want to know what’s really impacting them, and adjust their strategy accordingly. That’s why we created a powerful data processing pipeline that focuses on three major elements of event data:
Individual event sources often miss key pieces of event information such as event size, a precise location, end time, and much more– and that doesn’t even cover the inaccuracies. Our data enrichment process utilizes information from several event sources for the same event to ensure complete, accurate metadata for every event.
Without metadata, it would be impossible to make sense of the millions of data points we collect, enrich, and rank every year:

Metadata makes large datasets easier to sort and search for events based on volume, predicted attendance, by radius, and more. These granular details enable platforms to serve the most relevant events to their end users, enabling them to adapt more quickly in a dynamic world. But how does it work?
Hold onto your hats. We’re jumping into the rabbit hole of metadata and how it drives enriched, ready-to-deploy event data.
How platform users benefit from meticulous metadata
Imagine you’re the revenue manager for the Fairmont Hotel in San Francisco. In March 2022 alone, there were 771 events that took place within a 10 mile radius of the hotel:
San Francisco Unified School District Spring Break: 78,817 people
Game Developers Conference: 29,000 attendees
Spring Training: Oakland Athletics vs. San Francisco Giants: 24,937 attendees
San Francisco Saint Patrick's Day Festival: 20,000 attendees
South San Francisco Wedding Fair: 20,000 attendees
Journey with Billy Idol Concert: 18,064 attendees
NCAA Tournament West Regional Session 2: 18,063 attendees
Billie Eilish with Duckwrth Concert: 18,064 attendees
G League Ignite vs Santa Cruz Warriors: 17,618 attendees
Milwaukee Bucks vs Golden State Warriors: 17,494 attendees
And many more
A hotel revenue platform that integrates demand intelligence can focus on dynamic pricing by ensuring their end users know when to expect higher and lower demand than usual.
Leveraging details like predicted attendance, venue information, historic performer details and more, platform users can adjust room rates to maximize profits across all of their locations. But this only scratches the surface of the endless possibilities demand intelligence brings to technology platforms.
Five metadata fields tech platforms need in their event data
Aggregated metadata helps you find the most relevant events at scale – which makes it easier to find a signal in the noise. These discrete data points are the secret sauce that helps end users keep their plans updated to the minute.
Let’s take a closer look at five metadata fields that make our demand intelligence so useful for technology platforms and their customers:
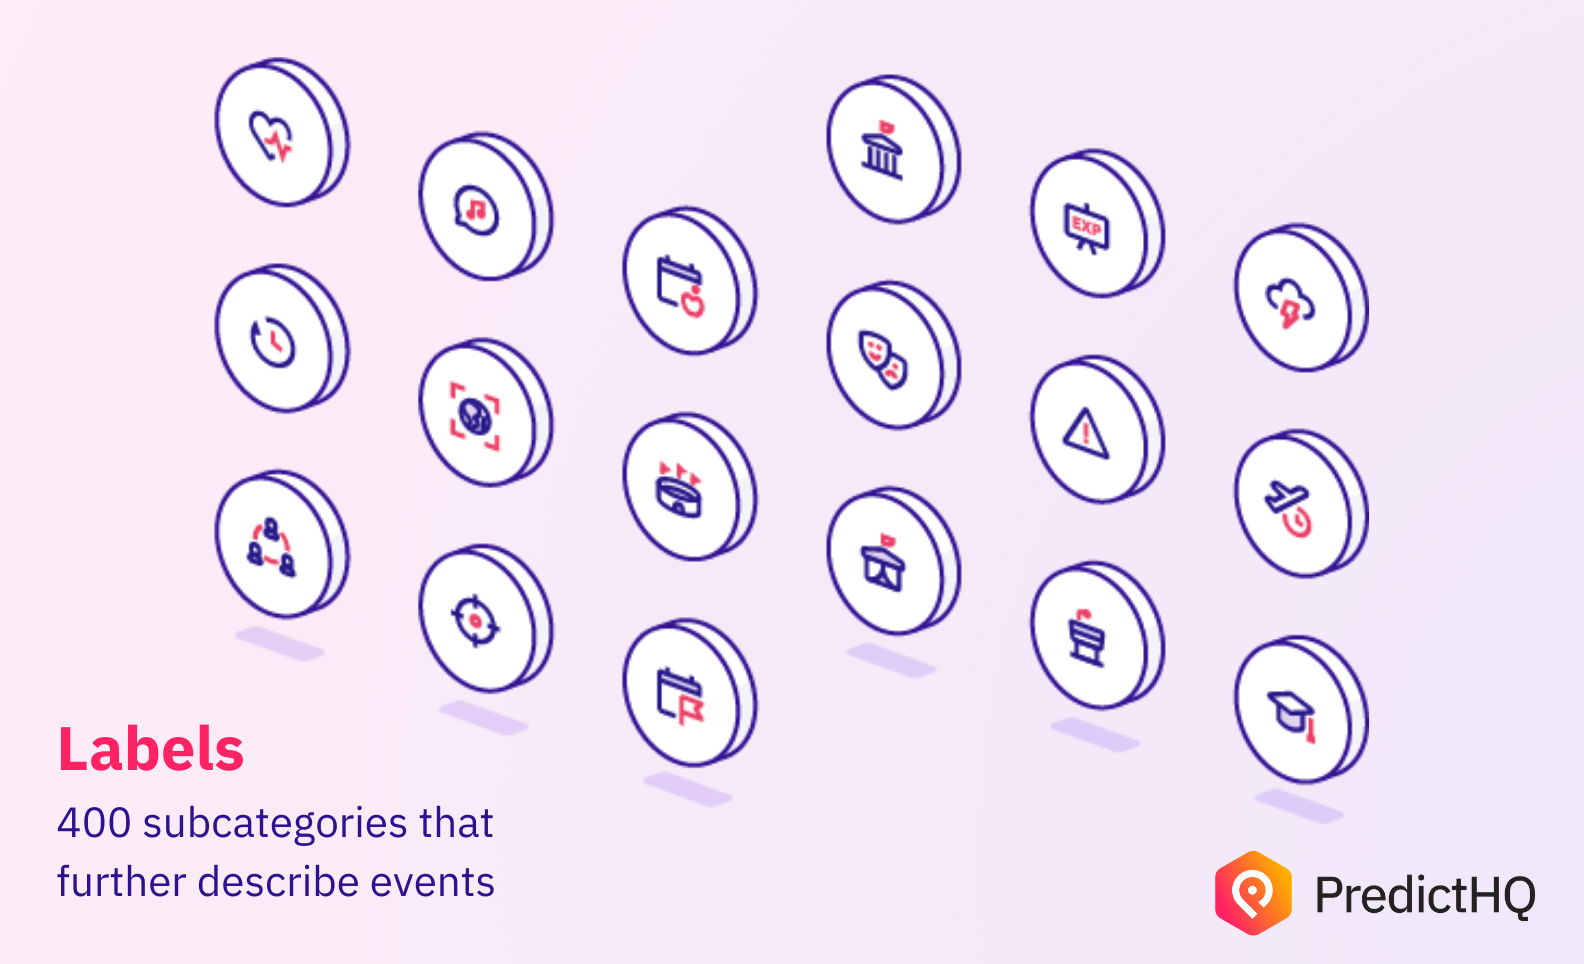
1. Labels
Labels are one or two word summaries that provide high-level descriptive detail about an event. Our systems include 400+ of these subcategories which are used as a filter to produce very granular results.
For example, events in the disasters category will have the "disaster" label, but an event might also have an "earthquake", "volcano" or "avalanche" label to further describe it.
Labels are particularly helpful when looking at events in your search results list to further refine your focus. Maybe your business is really impacted by college football games, but not by basketball games. Our labels enable customers to get to the most accurate representation of an event to save you time and ensure your business is prepared for the right events.
2. Predicted Attendance
Venue capacity is not a viable proxy for estimating attendance. We use our extensive knowledge graph to predict attendance based on inputs such as venue entities—such as venue capacity, day and time of the event, frequency, etc.—and performer entities, resulting in a reliable number that you can use in your models.
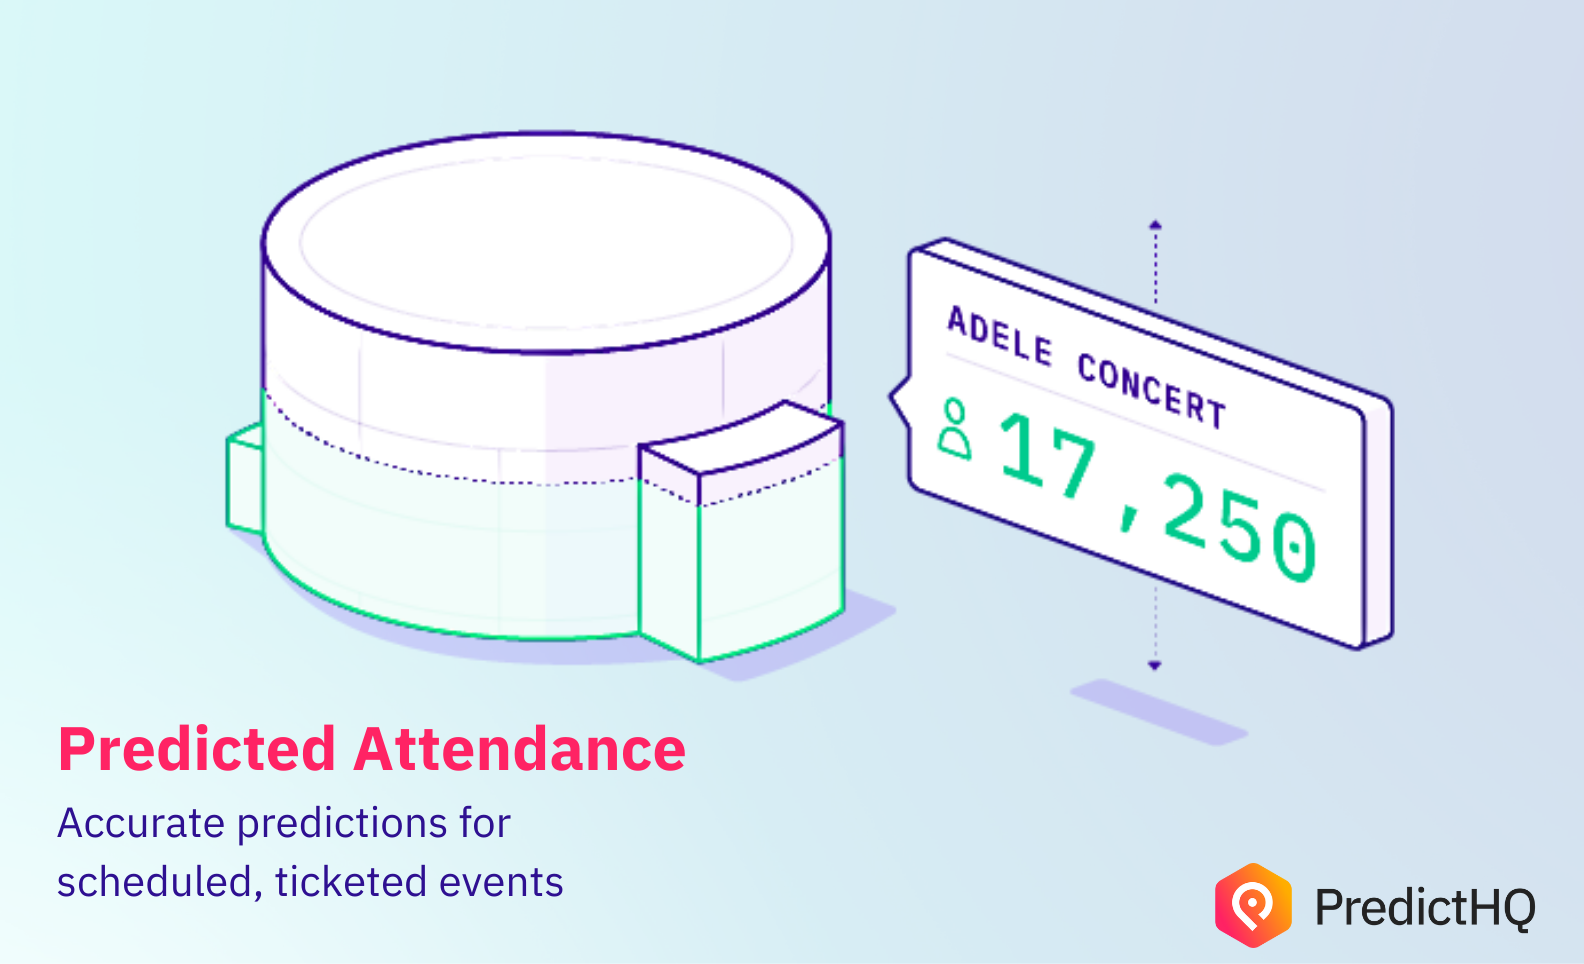
Predicted attendance is not a data point provided by most event data sources. We provide PHQ attendance for both historical and future events.
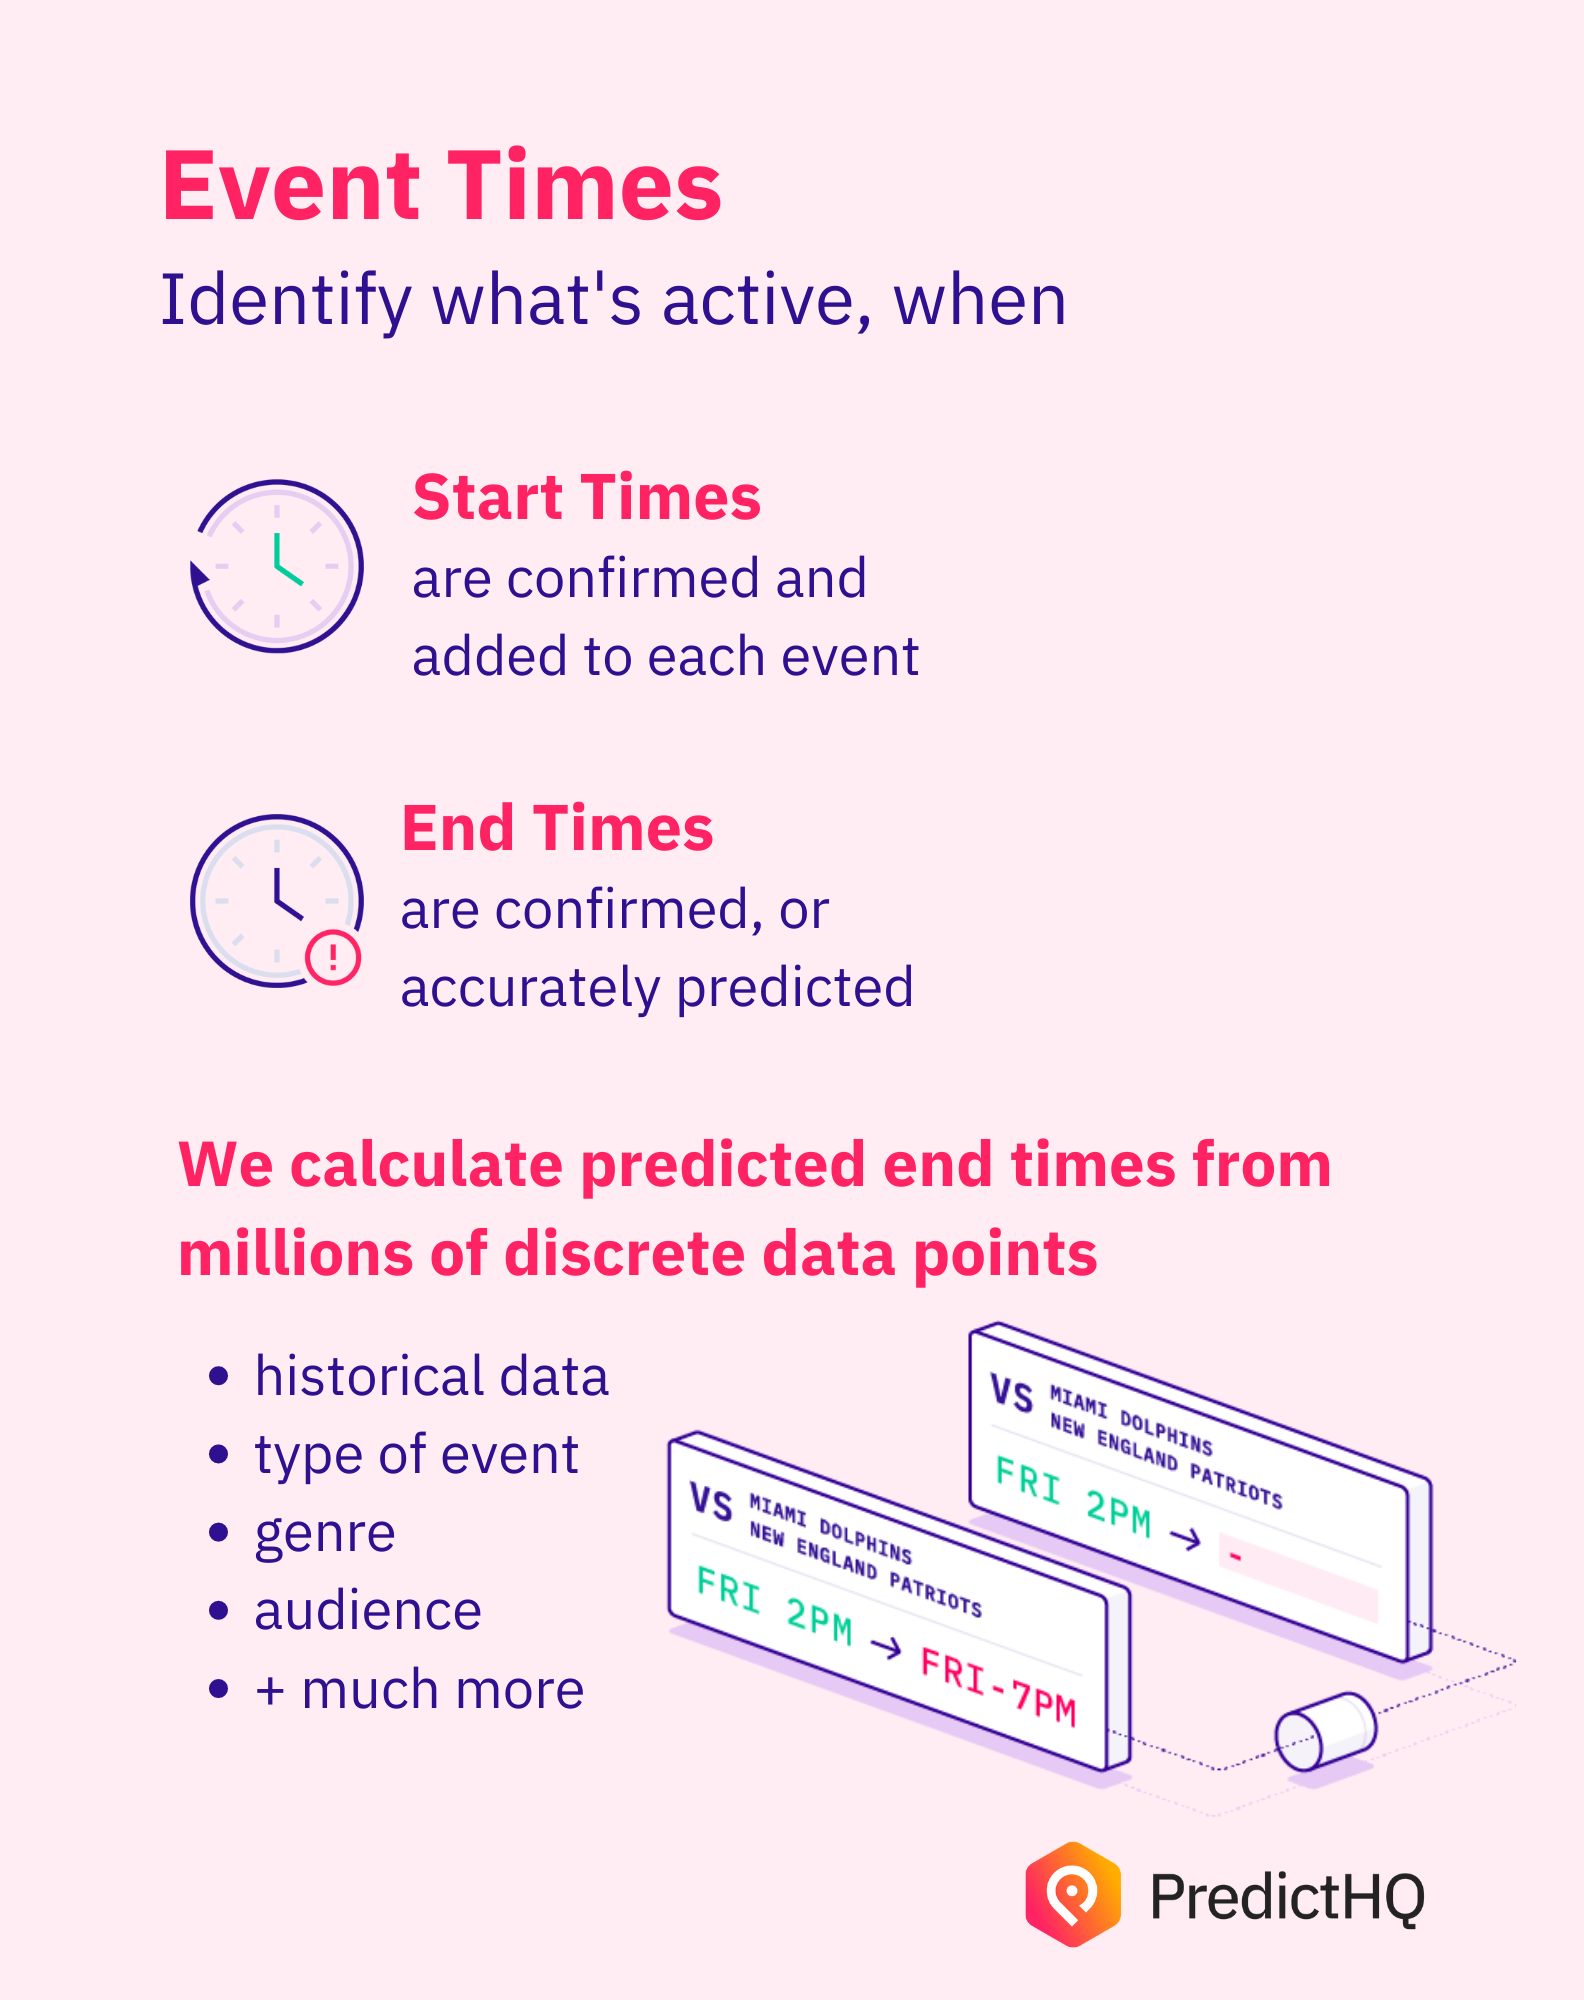
3. Event Times
We confirm and add start times, and accurately predict end times as most raw event data providers don’t include these. These times can be translated into the local timezone of choice, and used to see which events are active.
For transportation and retail companies, knowing when an event ends is critical to schedule their team and partners to meet after an event– and to be aware of demand surges caused by people heading home or stopping for a bite to eat along the way.
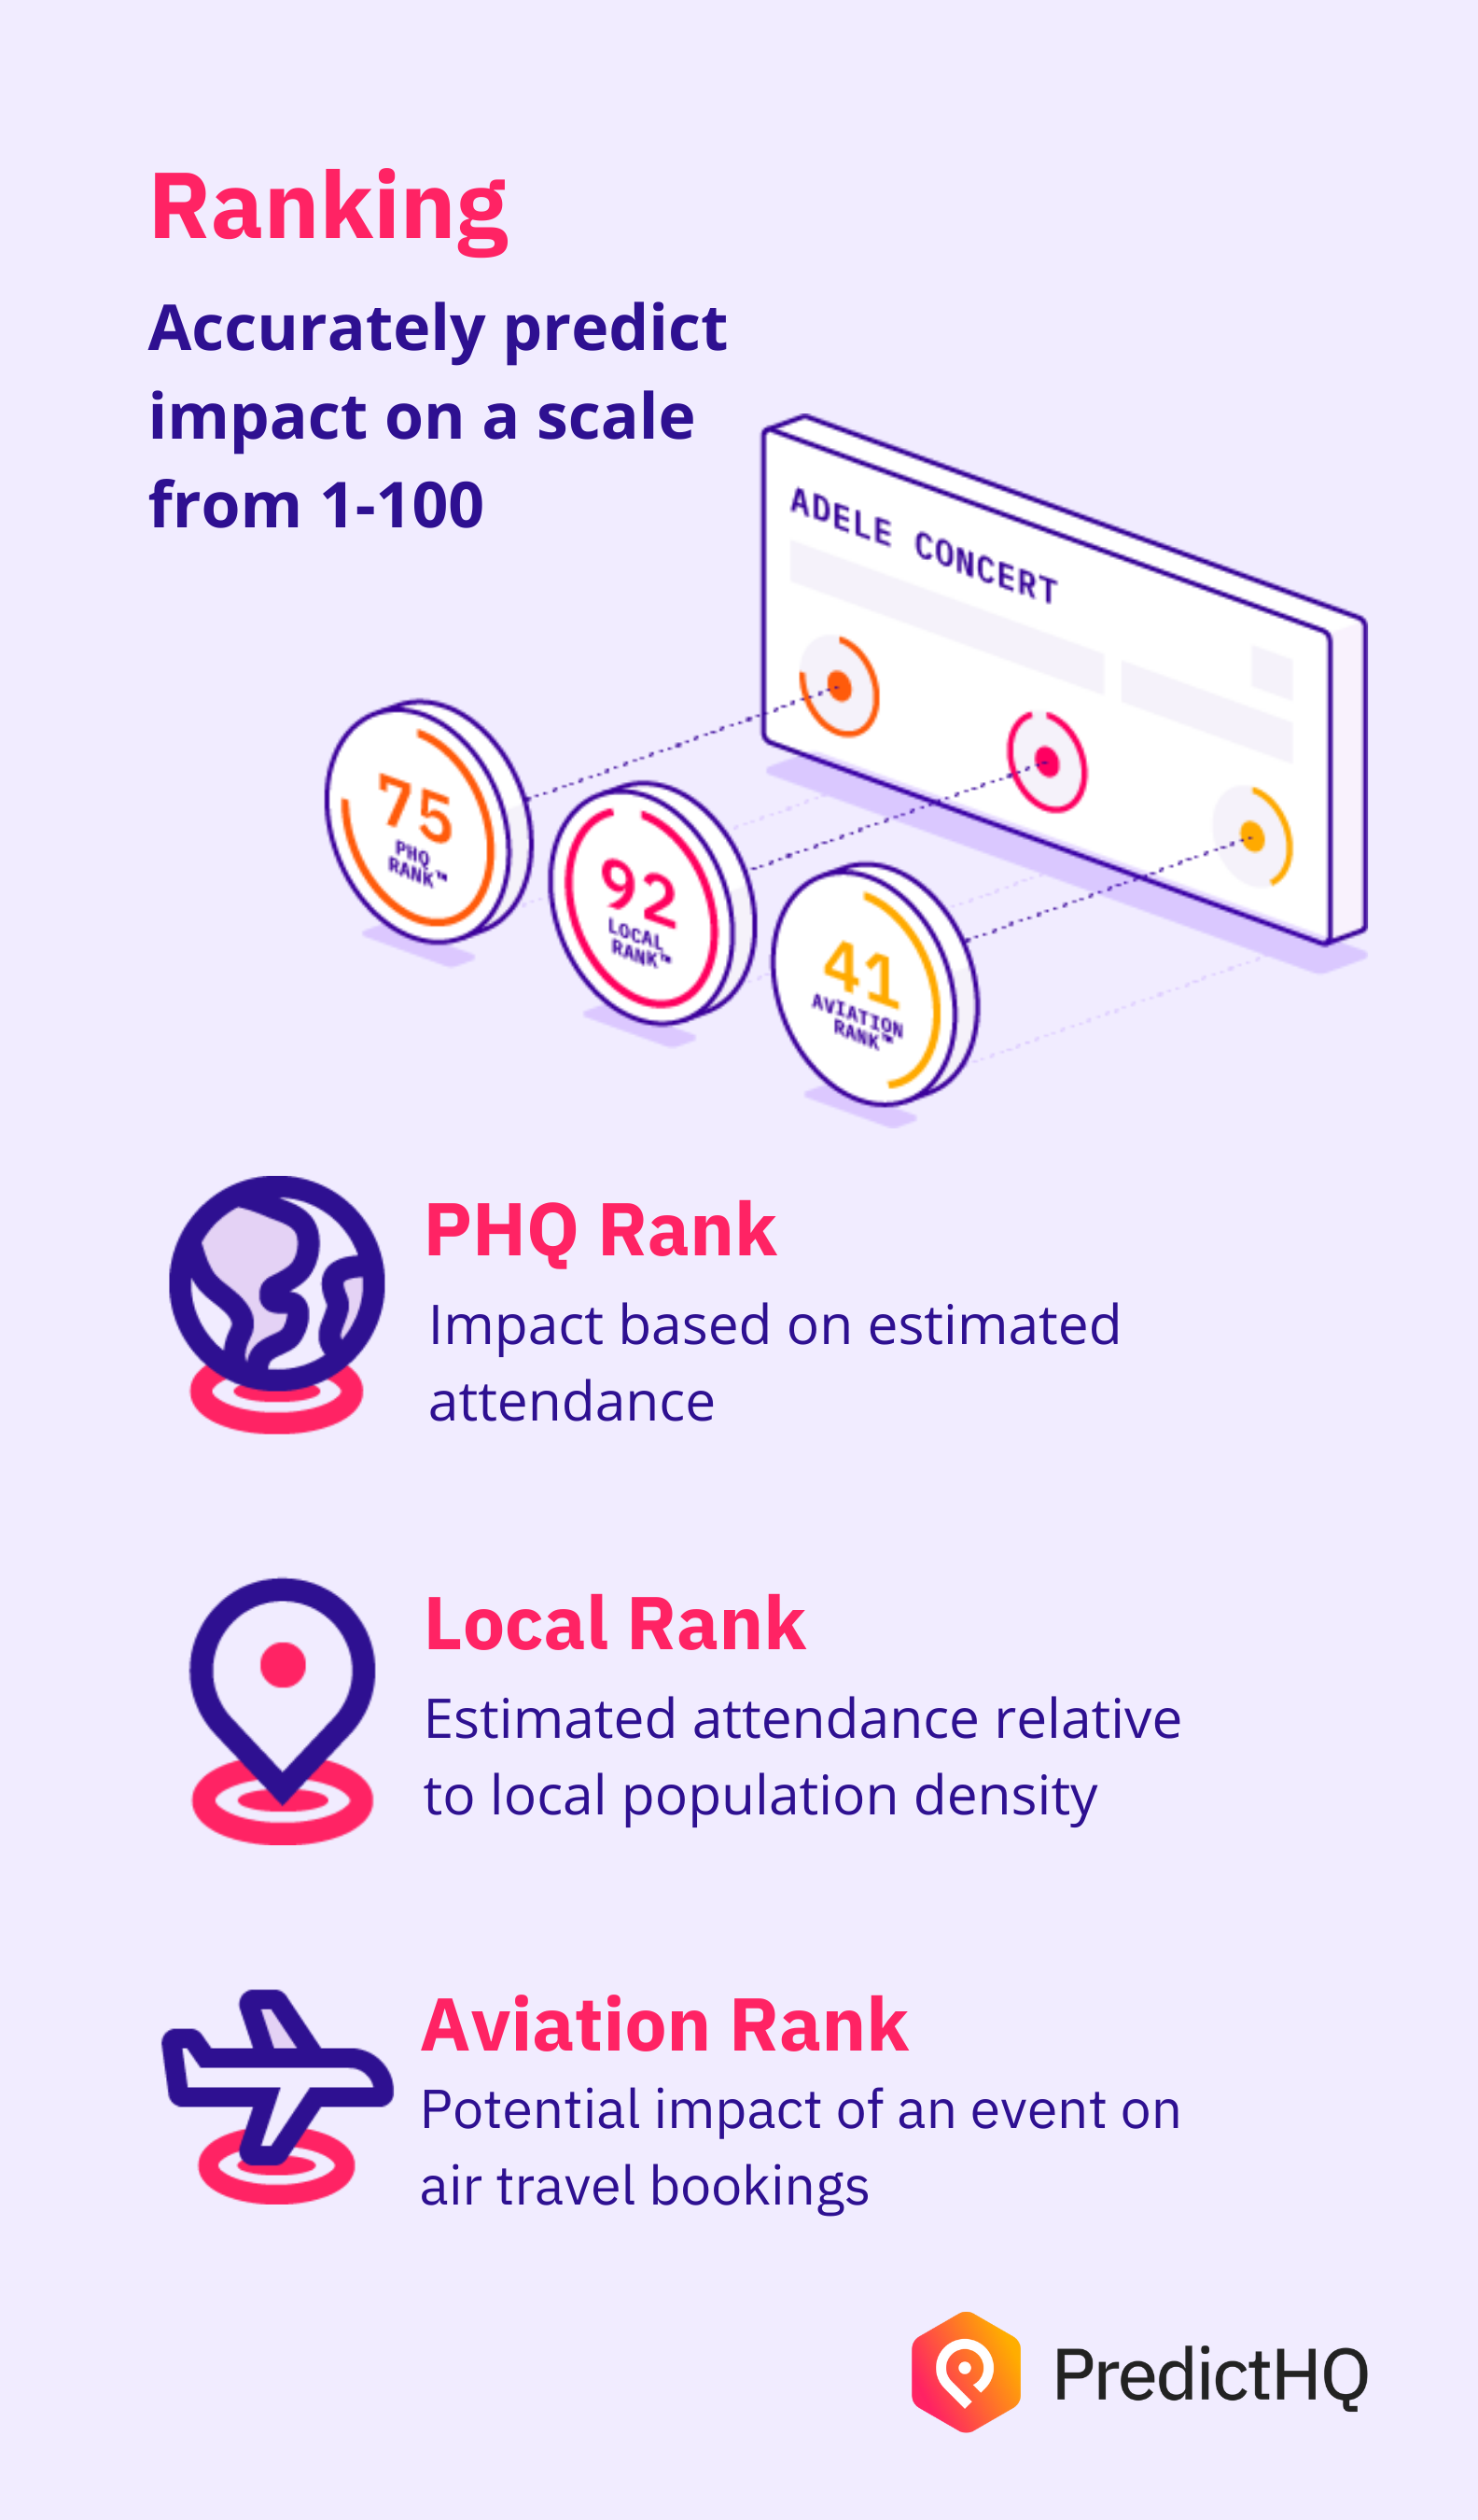
4. Rank
PredictHQ’s ranking draws on a broad and deep set of additional factors including entities, customized labels, location, population density, and unique repositories of historical data.
Rank enables users to identify which events will be the most impactful– i.e, which will drive the most demand. A retailer would want to know in advance if there’s an event within 5 miles of them with a local rank of 80, because it indicates there will be a significant spike in demand they can stock up in preparation for.
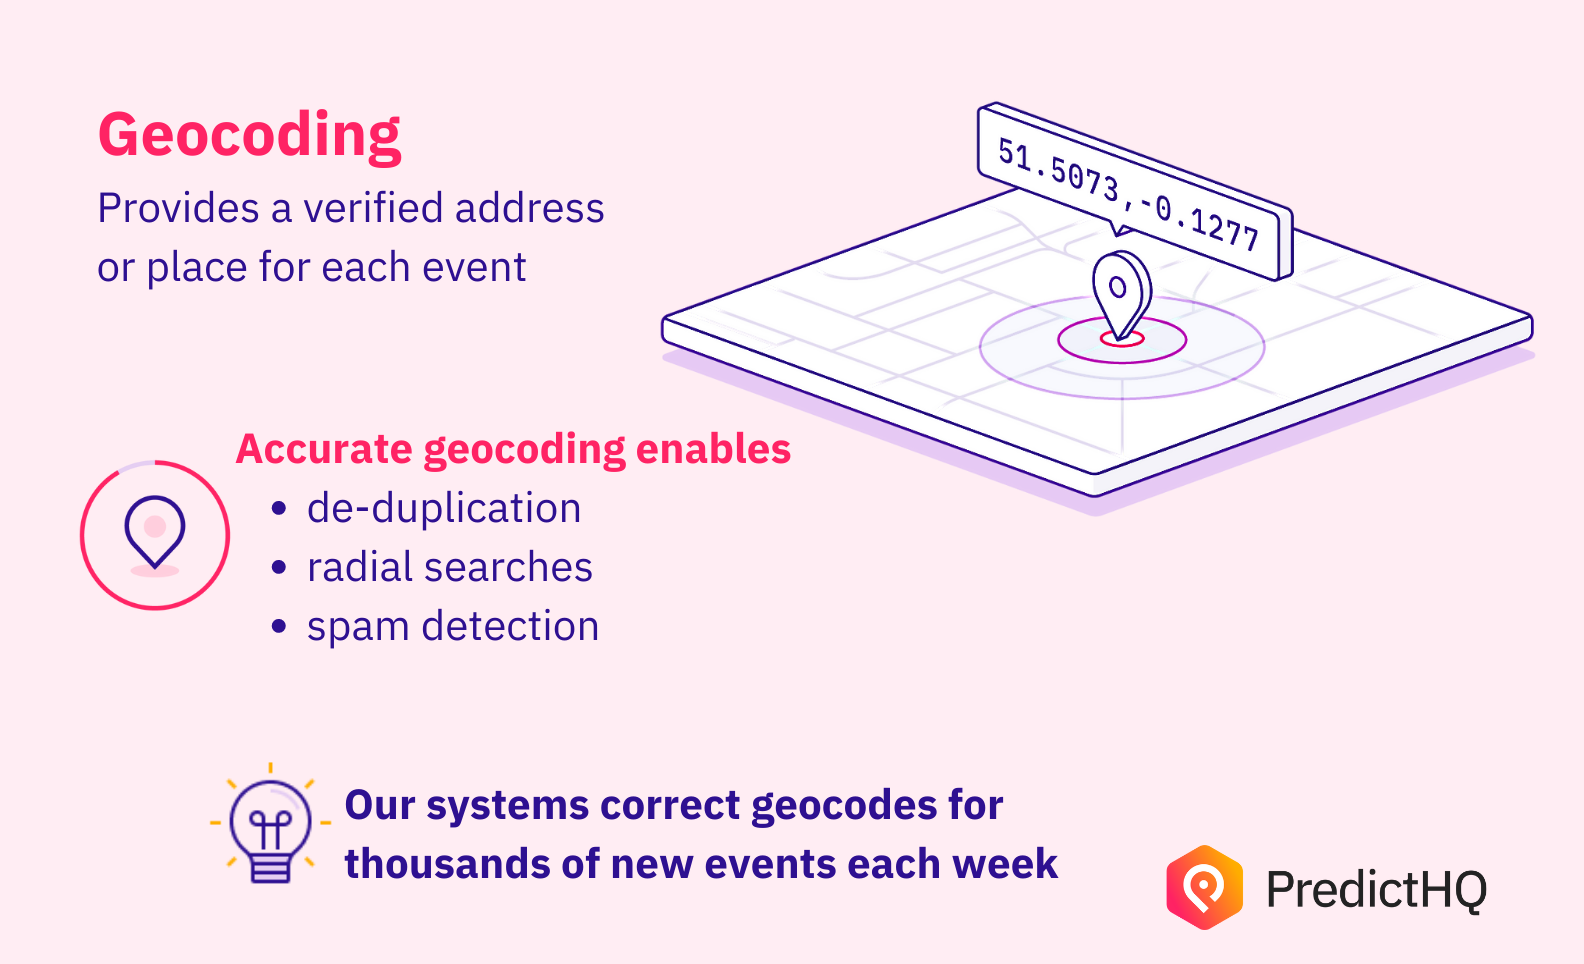
5. Geocoding
Each event is fixed on a pinpoint location based on latitude, longitude and timezone tags. Events that cover more than one specific geolocation, such as severe weather events, are represented by Polygons.
Accurate geocoding allows users to easily identify the event venue, attendance, and context– like whether an event is taking place in a stadium, or a sub venue within that stadium.
Have a handle on our metadata? The cherry on top is that our extensive metadata enables a host of dynamic, real-world aware features that enable data scientists, product managers and any user of PredictHQ to get more value, faster. The following features are built off of and leverage our metadata:
Technology platforms and companies that integrate our intelligent event data have access to millions of events across 30,000 cities informing their operations and customers.
Integrate our enriched event data to gain a new stream of intelligence and unlock deeper business insights for your end users. Speak with our team today about how demand intelligence can expand and create even more value for your platform offering.


