PredictHQ Quarterly Release – January 2022


Extreme weather events are becoming more frequent and more severe across the United States and in Europe, with severe weather events costing the US a whopping $145 Billion in 2021. Worsening climate hazards led to crop damage resulting in lasting surges in food prices for Americans– and scientists say there may be even more extreme weather heading our way in 2022.
Stay ahead of extreme weather and other major demand catalysts with three new updates that give you greater insight, better usability, and even faster integration:
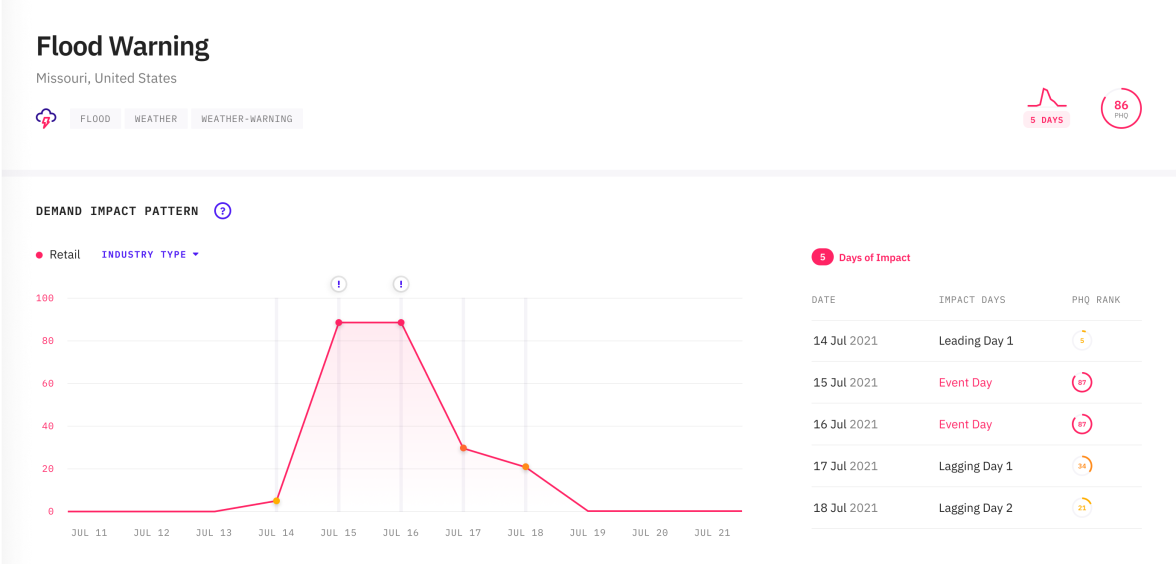
Use forecast-ready Demand Impact Patterns
Demand Impact Patterns are the generalized impact pattern of 73 kinds of severe weather events to inform machine learning models about the true impact of an event. They make it easy to identify the impact on demand leading up to, during, and days after severe weather events. You can now access Demand Impact Patterns through the API, meaning you can easily integrate them to update your forecasting models as soon as reliable weather data is available.
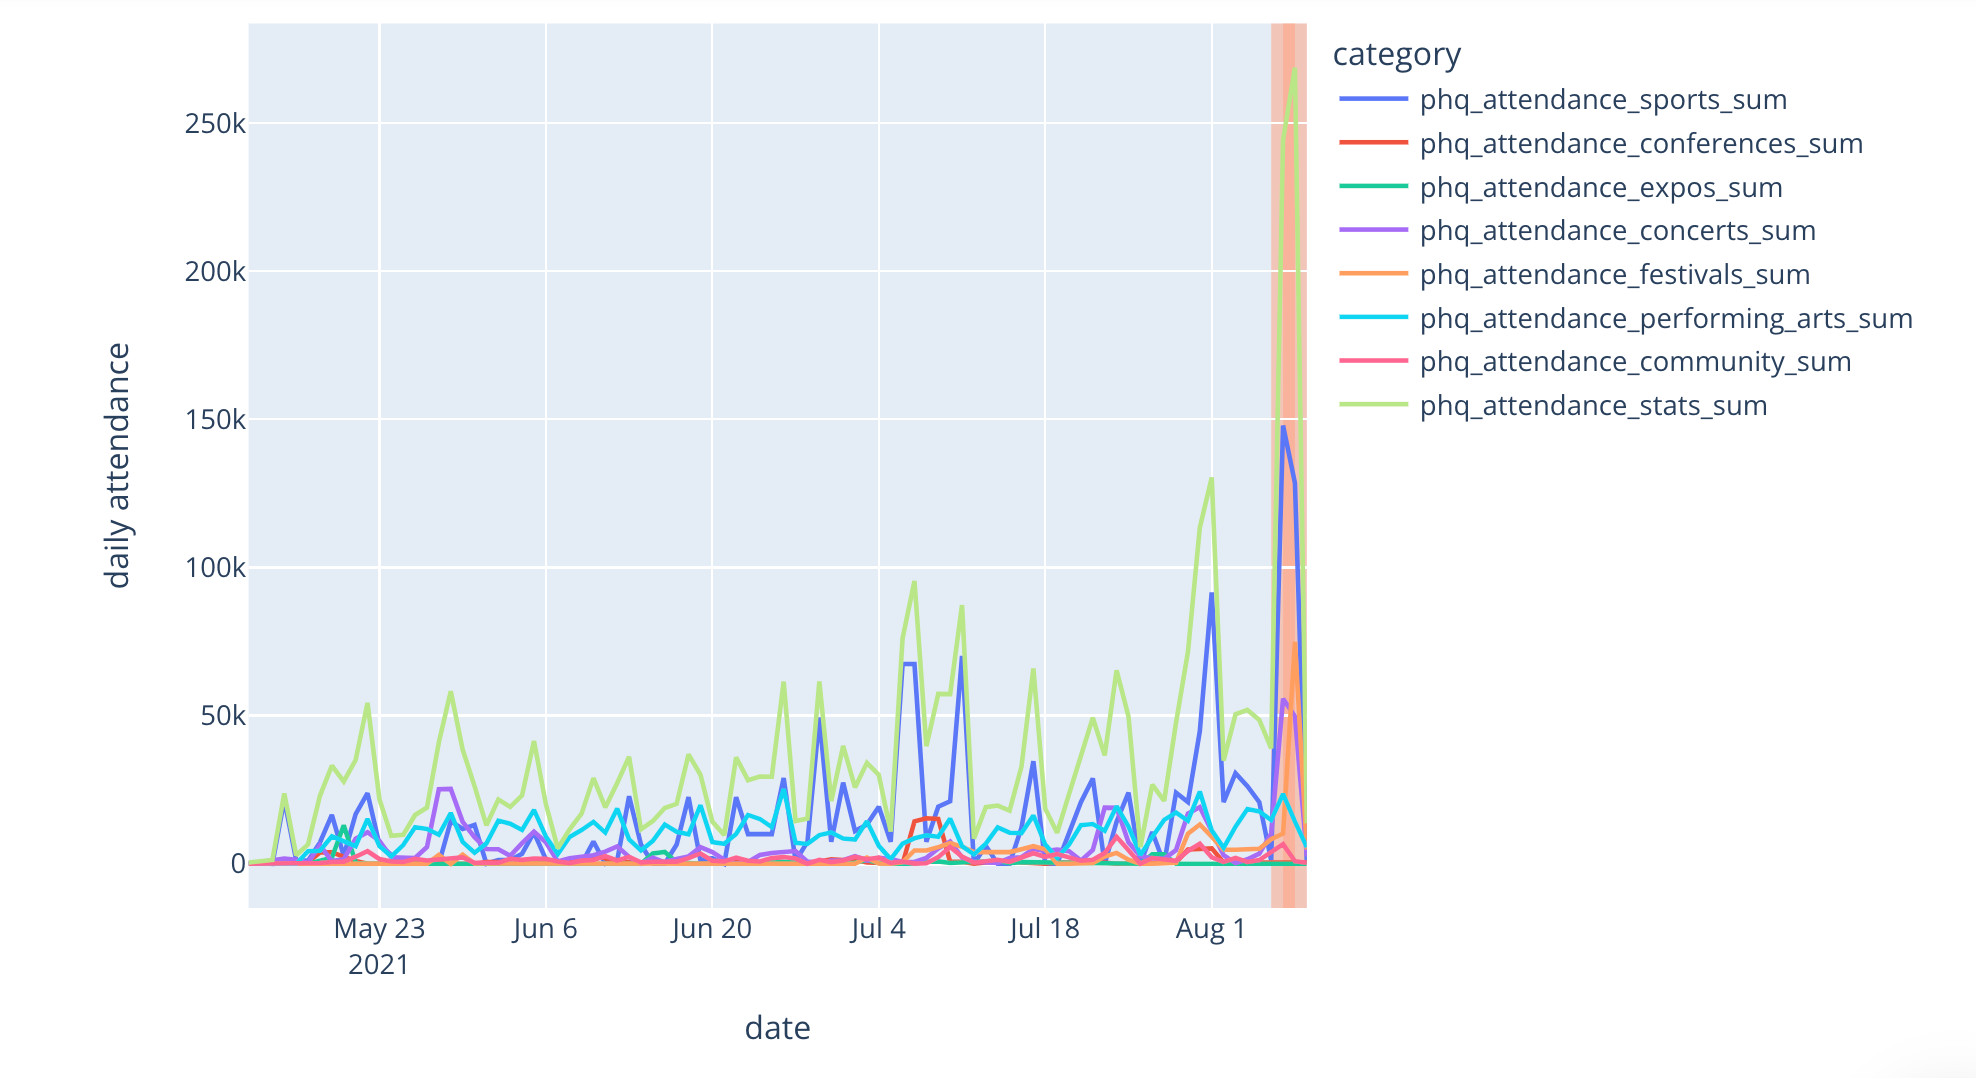
New Jupyter notebook: Easily find demand surges with our Features API
We launched the Features API in 2021 but we’ve recently shown a compelling use case that has quickly gained a lot of excitement: how you can find surges in demand with the features API. Read our demand surge Jupyter notebook guide today to start using the Features API to find demand surges near you.
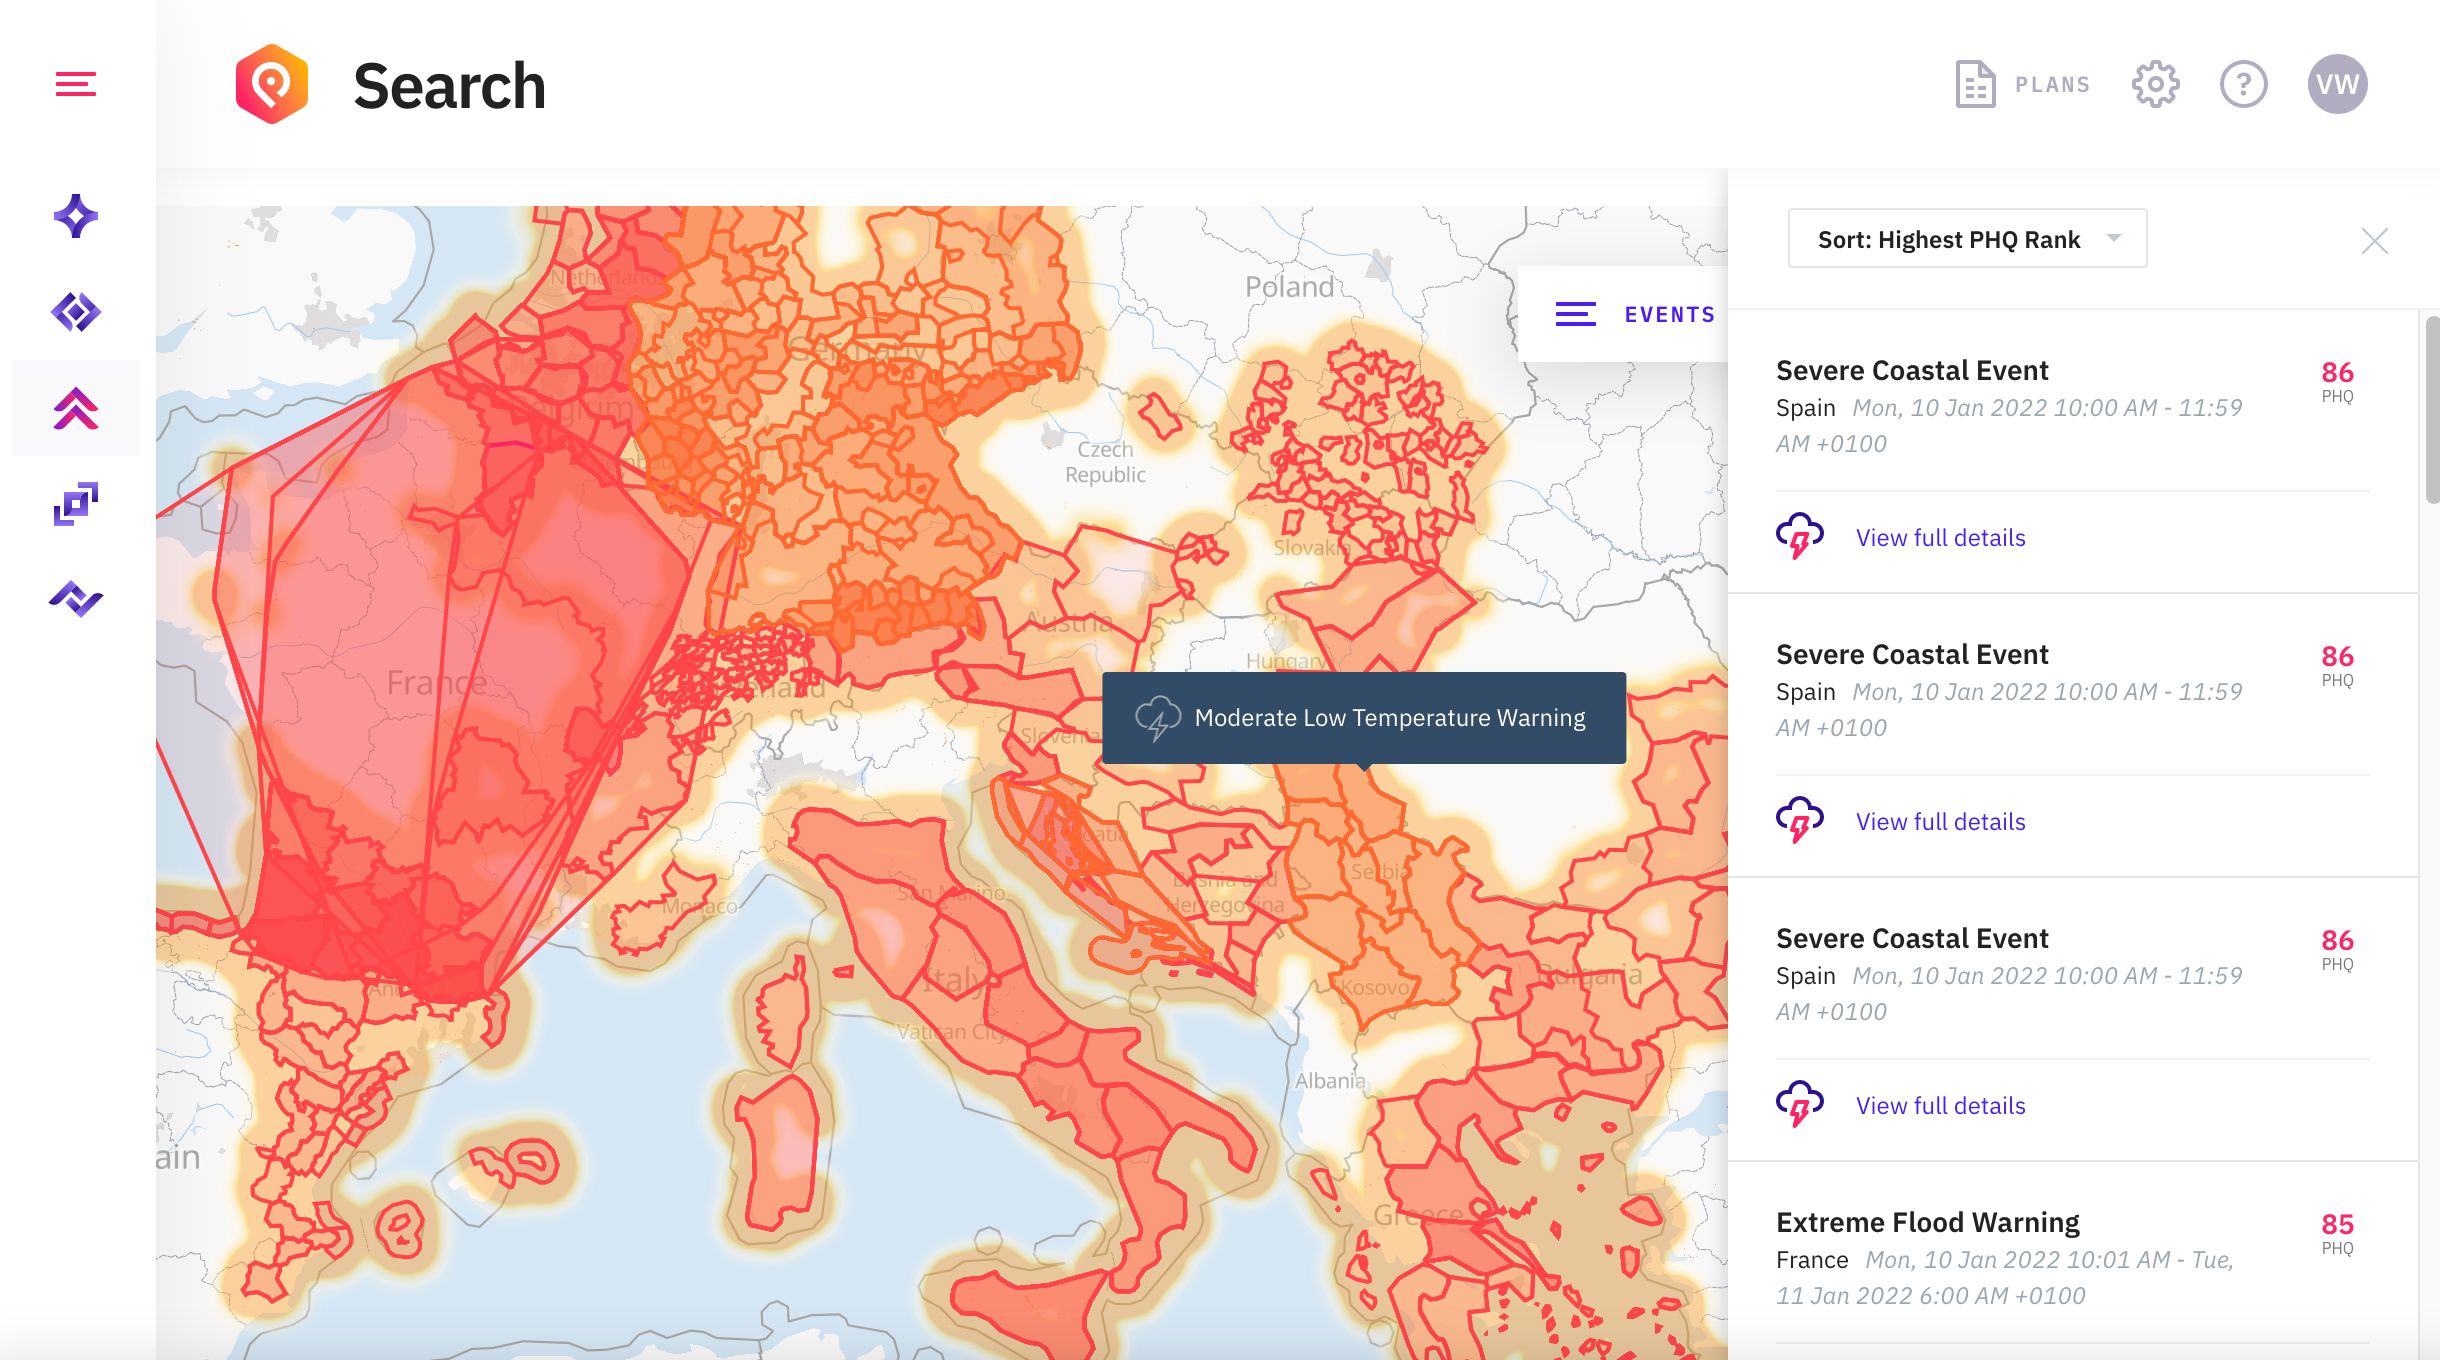
Identify areas impacted by severe weather with Polygons for Europe
Polygons accurately indicate the geographic area impacted by severe weather events within the Control Center map view or our Events API. We’re excited to announce we’ve expanded our Polygons coverage into Europe! Insight into individual events is useful, but many types of events don’t occur neatly at a single point on a map.
Point event locations are represented by latitude and longitude coordinates. Area events such as severe weather impact regions, states, and sometimes entire countries. When it comes to events such as hurricanes, tornadoes and more, the impact of an event is spread across an area.
PredictHQ’s Polygons enable you to see the full area impacted by an event represented as a shape, giving you a much more accurate picture of impact. Easily locate all impacted areas near your business sites to better understand which ones will be impacted, and to what degree. For example, there are over 1,000 severe weather events taking place across Europe within the next 30 days alone.
Want to dig deeper into these updates? We invite you to check out our Quarterly Release Webinar that covers our product updates from January 2022. We also encourage you to try the new features out to see how they may improve your workflow, or the way you use PredictHQ.


