Severe weather features are now supported in the Features API


Severe weather is one event category that impacts almost all businesses, and is always in play. How do you currently track severe weather and aggregate it at scale? If you’re building this dataset into your machine learning models, we have a much faster way to integrate it – PredictHQ’s Features API. The Features API is a library of pre-built forecast-ready features that you can use directly in your forecasting models. It is a powerful tool that reduces the time it takes to use intelligent event data in your demand forecasting models from months down to days.
We have first-hand experience in using severe weather to support forecasting and correlation use cases. By helping our customers navigate the complexities of integrating demand intelligence and event data, we have observed direct correlations between demand and severe weather.
This relationship is even stronger when deeper levels of granularity are introduced - such as individual products/categories or store attributes. And while we acknowledge that severe weather impacting sales is an axiomatic concept, the power lies in being able to accurately quantify its impact.
Another phenomenon we have observed is that a severe weather event may impact demand long before it happens, and will continue to impact demand long after it has passed. For example, while a hurricane may only last 3 days, its effects on demand are felt days and even weeks before and after it occurs.
Not only that, but different industries will be impacted differently by the same event. For example, retail industries may see a surge in demand for essential provisions in the days leading up to a hurricane, while the hospitality industry may suffer a drop in demand as people cancel their holiday plans.

The Features API primarily enables these use cases, so we bundled Severe Weather features with Demand Impact Patterns to bring the most useful features to our platform. Let’s walk through the highlights of the Features API severe weather expansion.
All 13 subcategories of severe weather are available as features
The features are very granular, allowing you to decide which of the 13 severe weather subcategories you wish to call. You can call as few or as many features as you need, depending on the relevancy to your business:
storm
tornado
blizzard
dust
hurricane
cyclone
rain
wind
sand
typhoon
flood
heat-wave
air-quality
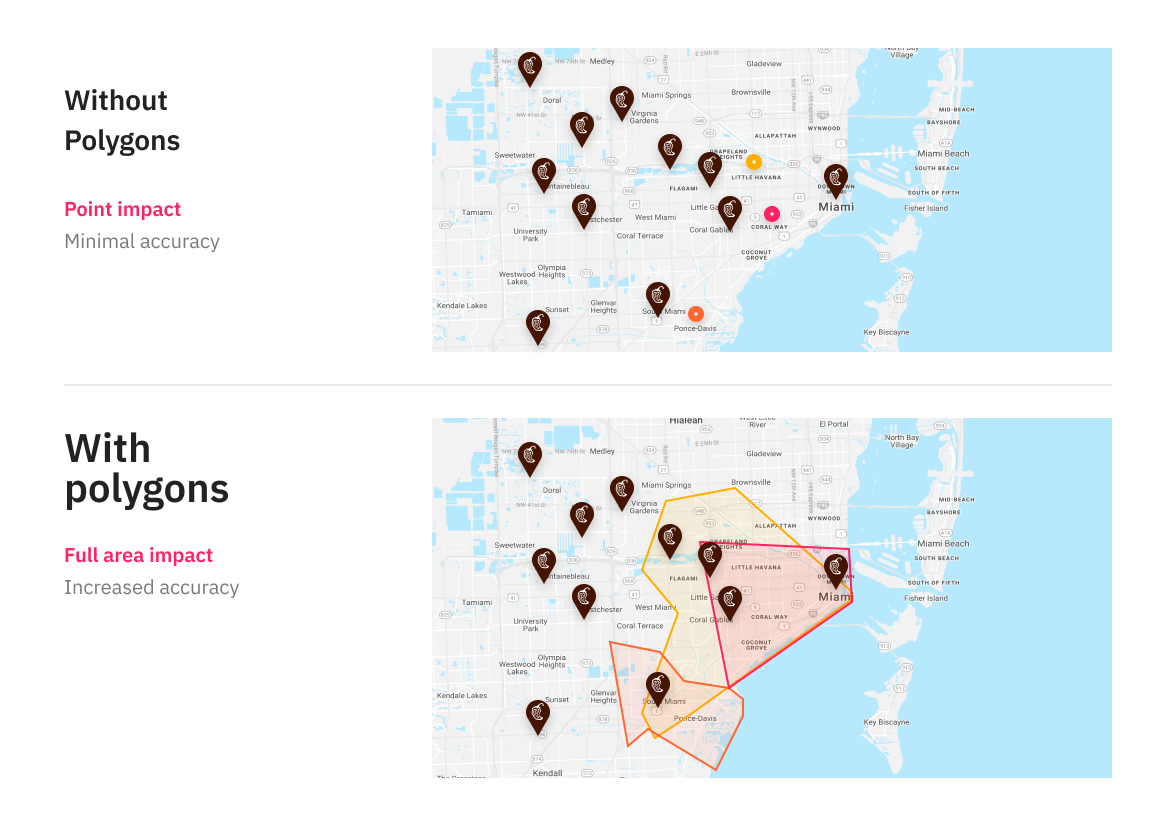
The expansion includes Polygon support for accurate geo-impact
Many events take place at a venue, with a neat point on a map. Severe weather events do not – nor do they impact locations in a uniform way. PredictHQ's Polygons enable you to see the full area impacted by an event represented as a shape– giving you a much more accurate picture of impact.
Polygons automatically update as severe weather events change direction, severity, and area of impact. Polygons are driven by the most up-to-date, accurate weather data available – so you can be sure which retail locations and supply chains are within the impacted area of the event, and quickly take action:
Identify and reroute supply chains that are likely to be disrupted
Update staffing schedules to reduce coverage at stores within the storm’s radius
Reallocate perishable inventory to less-impacted stores
Retail demand impact patterns are built into the new features
These severe weather features are now part of a new feature group, named phq_impact. This is to denote the fact that they are now compatible with demand impact patterns. Demand impact patterns enrich our events data with accurate impact curves across the entire lifespan of the event. This includes the very important days and weeks before and after the event actually happens to show accurate insight into the true impact of an event.
They pinpoint the generalized demand impact pattern of 73 kinds of severe weather events including severe cold, heat wave, severe rain, severe sandstorm, severe snow storm, and more.
With demand impact patterns, we seek to model the impact of events on industries most relevant to PredictHQ users. We do this via the Beam data lake that houses thousands of data points – which we use to accurately measure the impact of events on these verticals. Think of demand impact patterns as advanced features fine-tuned for a specific industry. For now, we have retail with future plans to expand into more industries.
Start using prebuilt forecasting features today
As a Features API expansion, this release primarily benefits forecasting and correlation use cases, where you can quickly retrieve forecast-ready features for use in your analyses. Start taking advantage of the new severe weather features today.
Get started here with the technical documentation for this release.


