Using Control Center
How to use Control Center to manage your plan, explore the API and search for events
With Control Center you can discover and manage the API, and all of the demand intelligence data your business needs in a single place. You can find Control Center at control.predicthq.com.
See below for a video on getting started with Control Center and the PredictHQ platform.
See also, other videos on Getting Started with Control Center
Navigation Control Center
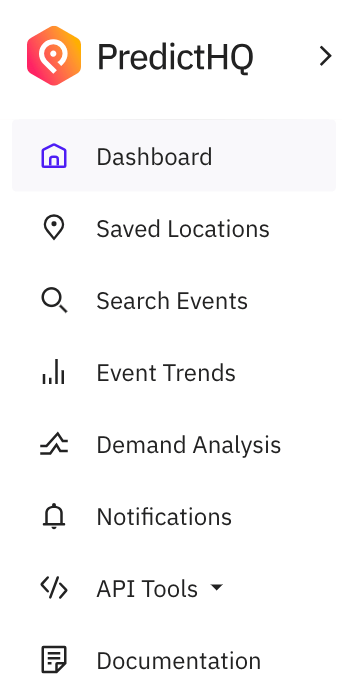
The Sidebar
The sidebar gives you access to all the functionalities within Control Center, which includes:
Saved Locations
Search Events
Event Trends
Demand Analysis
Notifications
API Tools
Documentation
The sidebar is fully expanded by default. You can choose to toggle the arrow in the top right of the sidebar to collapse by default and only expand the sidebar when you are hovering over it. You can toggle it again to keep it fully expanded and visible.
Saved Locations
See An Overview of Location Insights (Saved Locations).
Search
Event Trends
The Event Trends tab in Control Center gives you access to a graph view of predicted attendance and predicted event spend at a location to allow you to easily identify trends and demand fluctuations. Use the tabs at the top of the page to toggle between viewing Predicted Attendance or Predicted Event Spend, then filter by location, rank, and date range to view the total impact of all events by day for the selected time period.
See Using Event Trends for more details.
Demand Analysis
See the Beam (Demand Analysis) support category.
Notifications
See How to Set Up Notifications.
API Tools
See API tools.
Documentation
This links to our technical documentation.
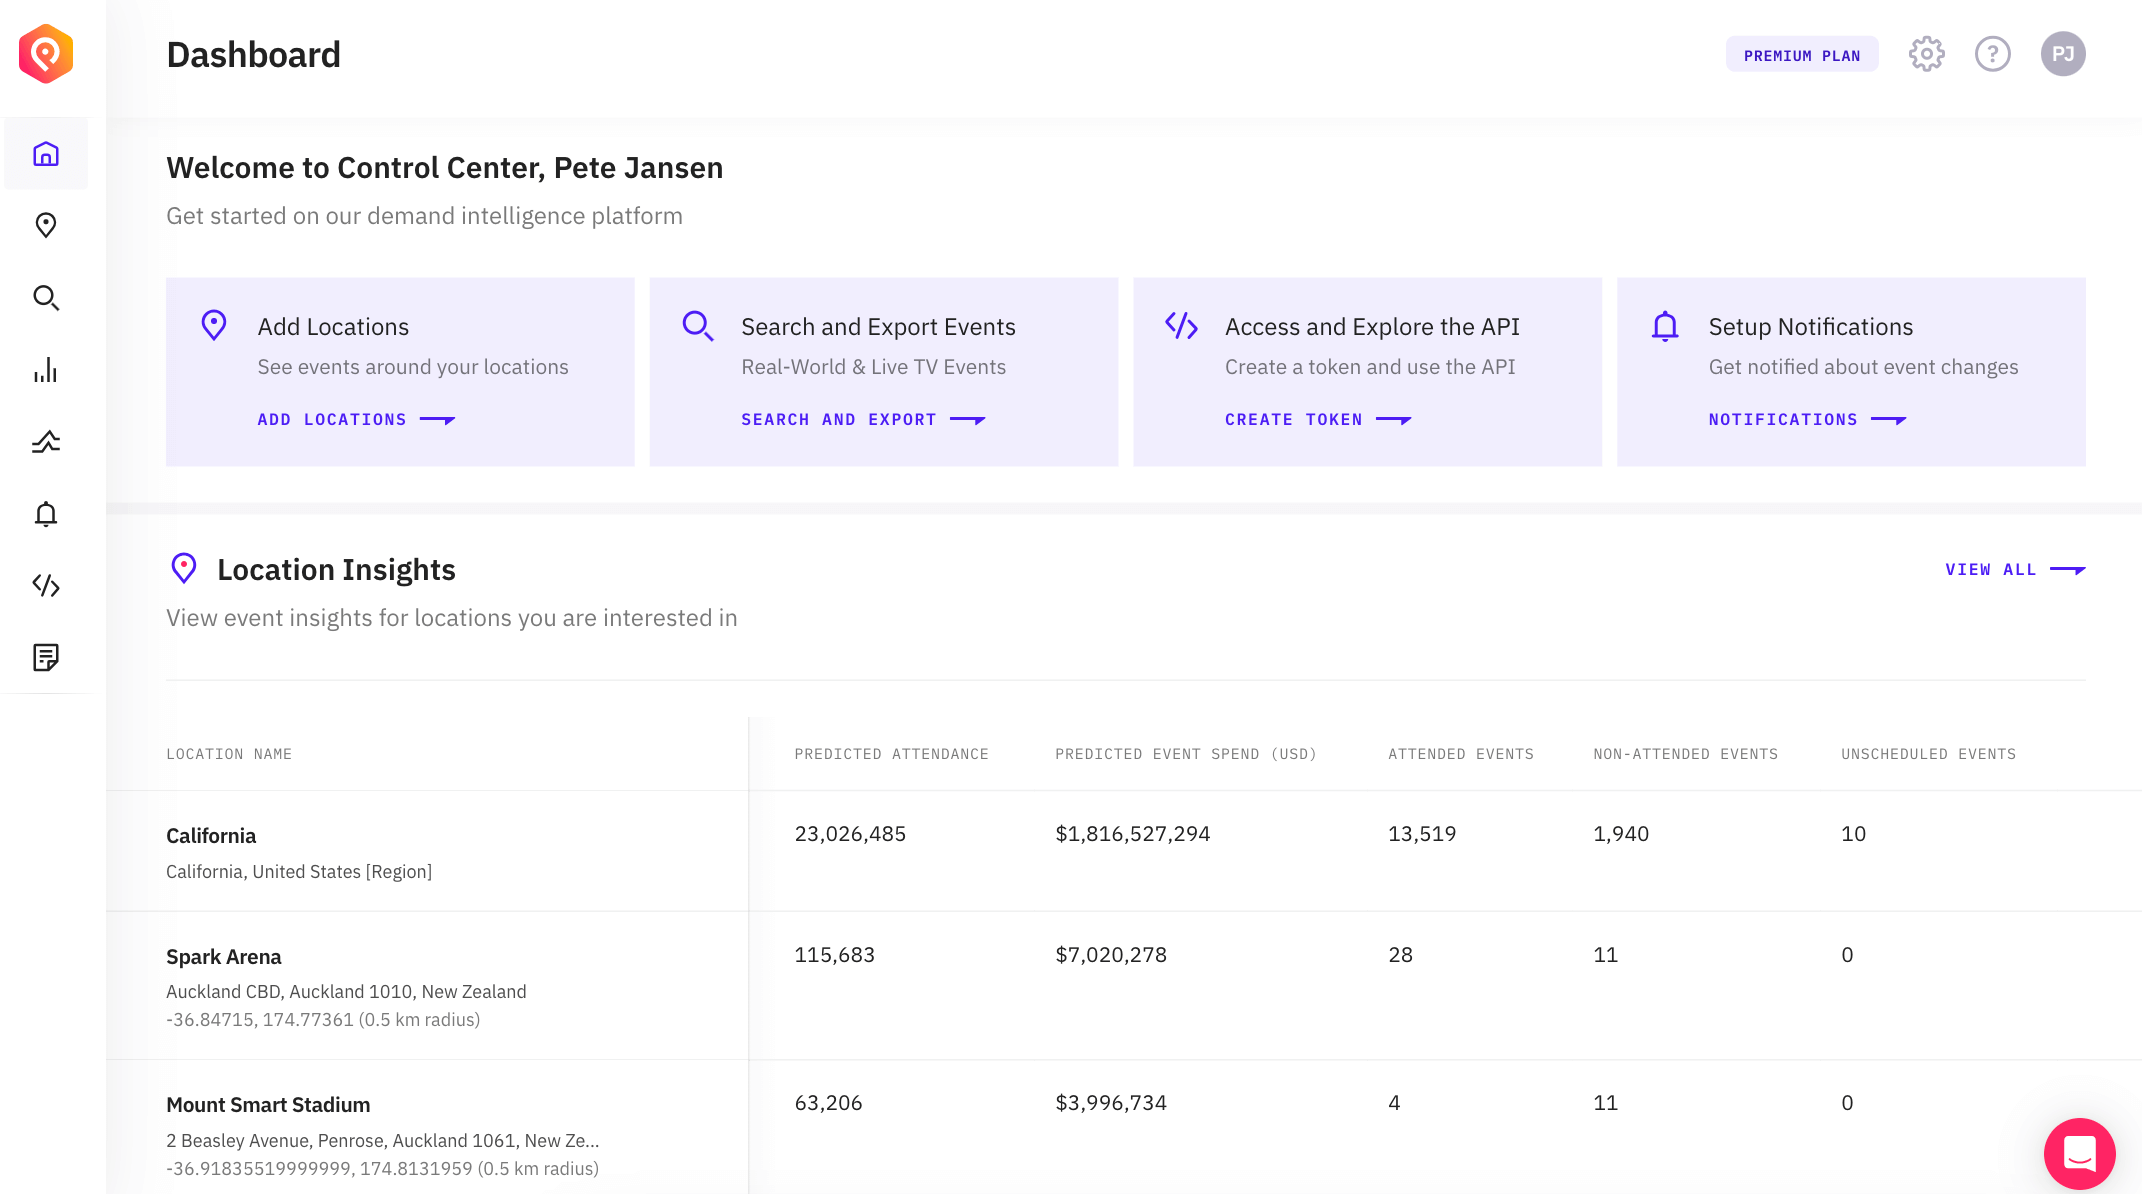
The Dashboard
When you log into Control Center, you are taken to the dashboard. The dashboard shows a list of tiles that are shortcuts to common operations (like search and notifications). It also includes your top five Location Insights locations. These are the locations with the highest predicted attendance.
Options in Control Center
Navigating within Control Center is easy. At the top, you'll have four options:
Plans
Settings
Help
Profile
Plans
The colored tag in the top right will show the name of your current plan and you can then click on it to view more details about your plan. On the plans page, you can see all of the features you have access to on your plan including event visibility, category access and add-ons.
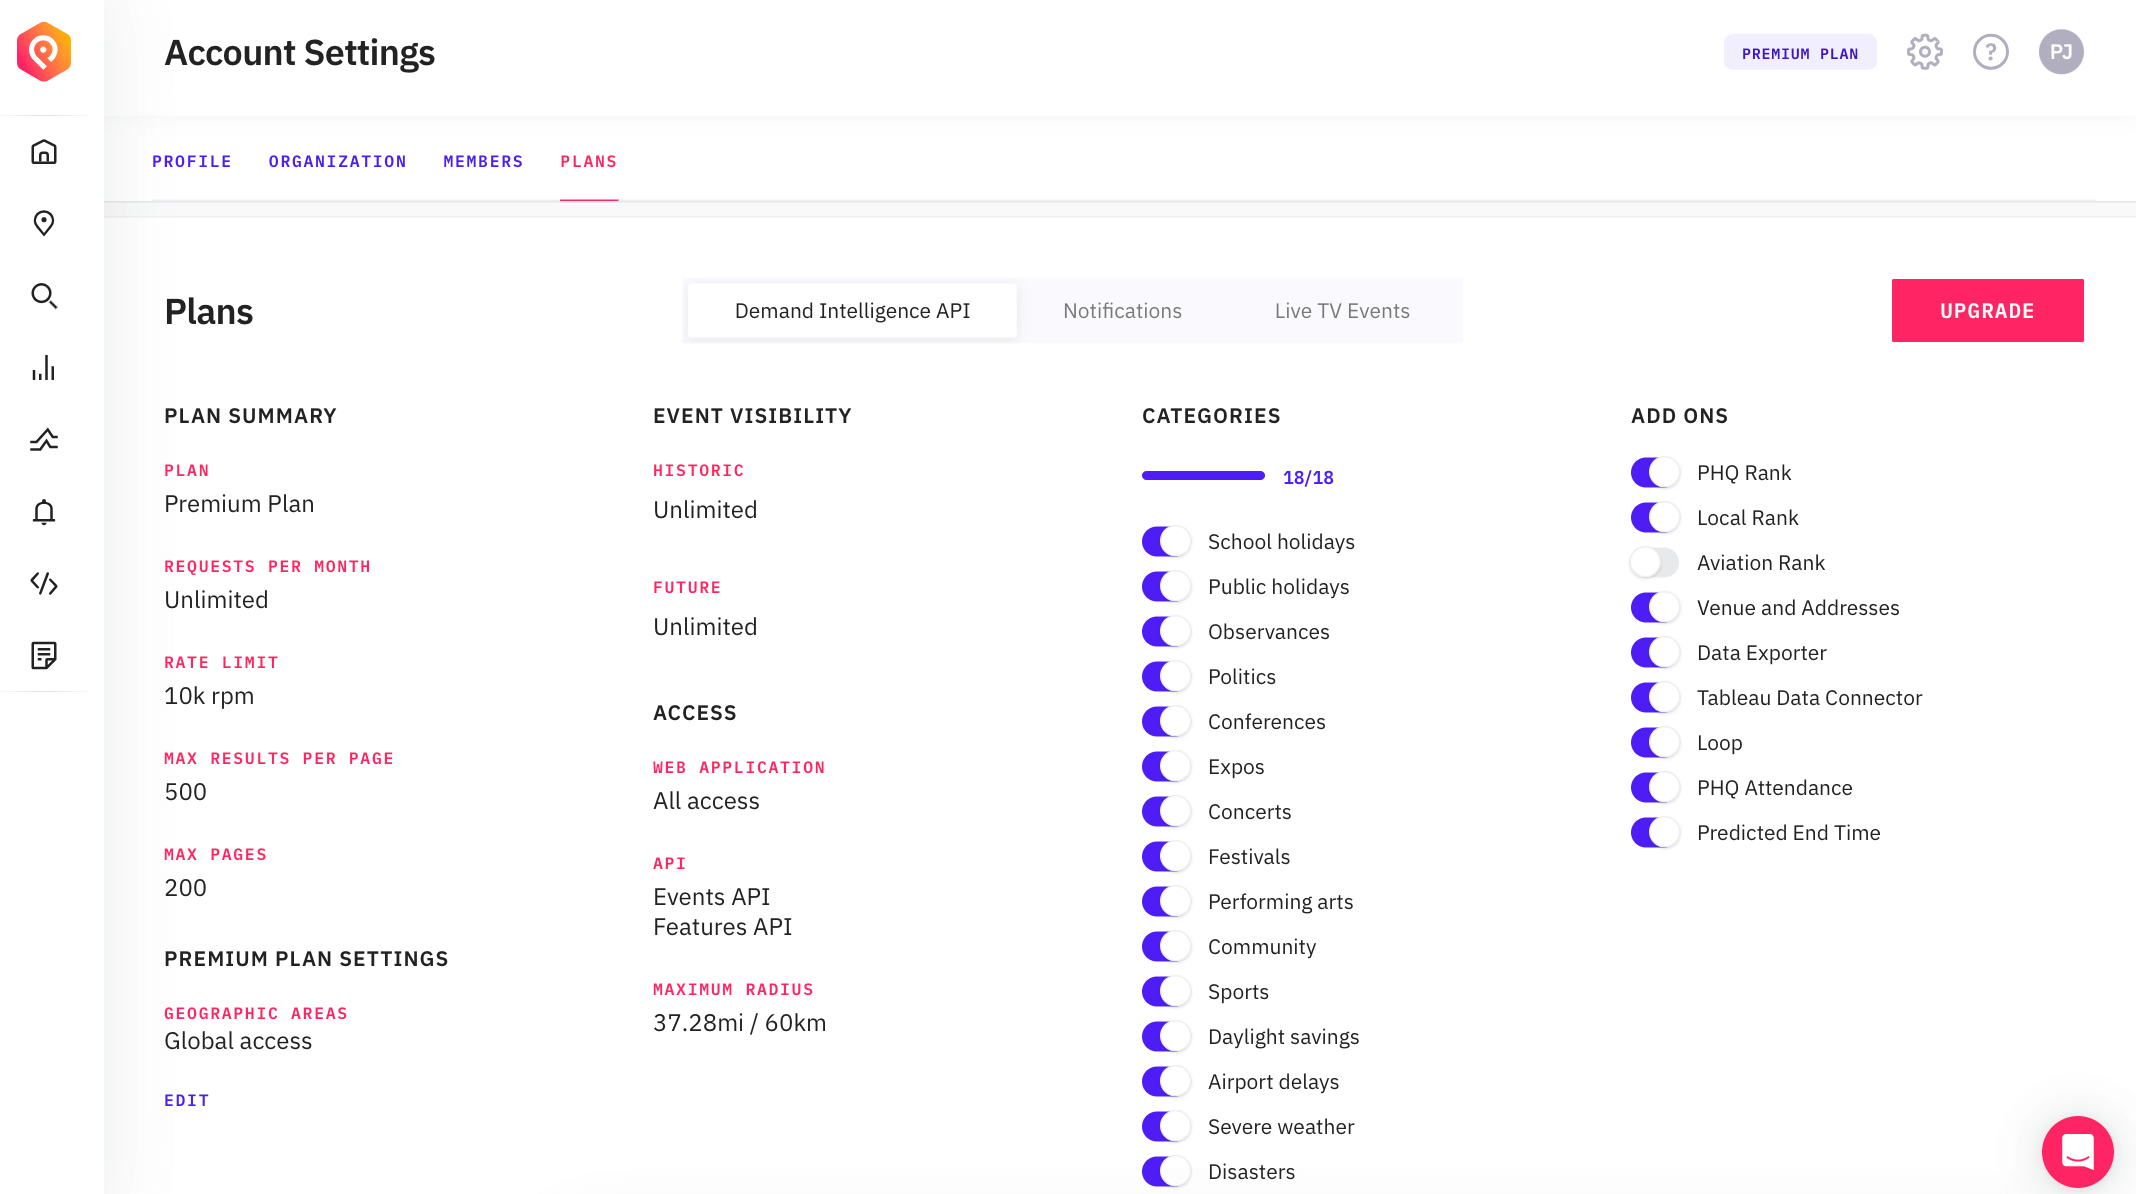
You'll either start off with a trial subscription, or you may be on a paid plan. For our 14-day trial, you will automatically be moved to the Free plan after 14 days which has limited access.
If you're on our Premium plan and want access to more cities, greater historic visibility, more categories, or add-ons, click on the relevant field to open the Upgrade Request feature. Select the options you would like to request to expand your subscription. For our Starter plan you can edit your selected categories and cities directly in Control Center.
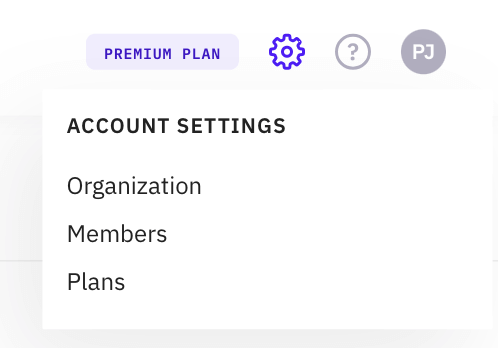
Settings
The Account Settings functionality allows you to manage your profile, invite other users to your organization, view billing details and manage a range of other settings for your subscription.
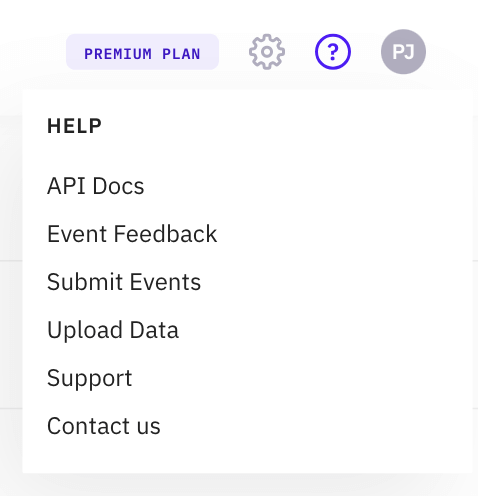
Help
In the navigation options in the top right of Control Center, you can also access Help details as shown below. Select this option to find API documentation, link to our Support knowledge base, and to Contact Us. You can also use submit missing events and feedback to us via our Loop feature.
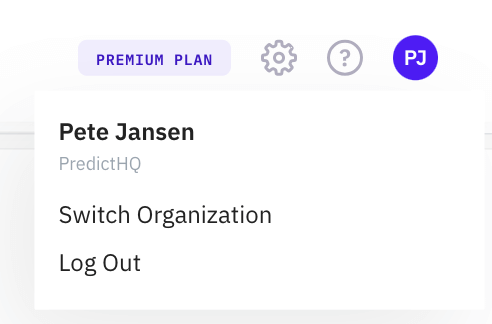
Profile
Clicking on your initials in the top right allows you to switch organizations and log out. Switching organizations is available if your account is a member of multiple organizations.