How to build an event data source: the 8 most important steps to ensure it’s accurate and useable


So you’ve been tasked with finding event data to use in your company’s demand planning or forecasting. Congratulations! Event data is a highly impactful source of intelligence, yet a complex one to wrangle into a usable format. In this post we walk through some of the most common issues people run into when trying to gather event data they can use.
If you’re trying to DIY, you’re going to need to find the right data sources and create a data processing pipeline or a verification process for your team to get the events you need in a format you can rely on. Below, we document some of the most significant steps to get right before you use events to inform staffing and inventory strategies, or make pricing decisions on your new data.
You’ve almost certainly realized manually tracking events doesn’t work ( as it is time consuming and error-prone). The purpose of this blog is to outline the critical data verification and enrichment steps required to get to usable data. I’m not going to lie - it’s complex. At PredictHQ, we have built more than 1,500+ machine learning models to solve the unique challenges of event data accuracy and enrichment. But this post only focuses on the initial few steps.
Coverage: Getting the types of events that matter for your business
First things first: what kinds of events do you need to factor into your plans? You probably already have some educated guesses about which events impact you. Here are some of the most popular event categories that impact most businesses:
There are many more, but most people start with the above.
Many businesses already track upcoming events manually if they have locations right next to a venue – but those seeking event data have realized that being real-world aware requires a more comprehensive view of the demand triggers around them. This means starting with a mix of events is essential, because without it:
The risk of misattributing causation and even correlation is too high. Was it that baseball game last week that triggered the long lines at your store that caused a lot of frustration for customers and forced you to run out of a few key ingredients, or was it the baseball game plus the conference of 15,000+ doctors that met around the corner from your store location?
Or you might be assuming that the sudden spike in hotel bookings in a few weeks is because spring has arrived and there’s a great string of concerts on or near that property, when actually there’s a major community event that a lot of folks have traveled across the state for.
Regardless of the kind of business you have, you’ll need to collect data for a range of events to arrive at real-world awareness for your locations. You’ll need to interrogate your assumptions too, and compare your historical data to historical event data to confirm the events you’re after are telling the whole story.
There are a handful of expensive specialist providers that provide one category of events, as well as some ticketing APIs and a few event sources that scrape the internet for particular kinds of events. But getting the data is the easy bit. Verifying and enriching it, removing duplicate and misleading events, and making it easy to use is where the fun starts.
Checking for duplicates and event details: prevent skewed forecasts with accurate event details
Even if you’re only using a handful of data sources, there are some critical quality steps you will need to take to make sure you’re weeding out the events and event details that are wrong or misleading. These will cause you to plan for demand that simply won’t occur.
These include:
Identifying add-on events: Many events in ticketing APIs and similar are what we call add-on events i.e. there is a concert for 25,000 people, and there is another event listed for parking for that same concert that is for 10,000 people, and an early access VIP pass for 5,000 people. If you don’t remove these, you’ll be expecting a total of 40,000 attendees, which is significantly more than will actually attend.
Identifying duplicates: This is important when using multiple sources but also in APIs where the content is user generated or not carefully vetted. Three versions of an event with 15,000 people expected adds up to 45,000 people, which would seriously distort any demand planning you’re attempting.
Making sure the geographic location is correct (and current): it’s remarkable how often a venue, address or latitude-longitude of an event is wrong from many event providers.
Making sure the date and time is accurate: again, it sounds simple but it’s one of the most frequent errors we find comparing and correcting event listings.
At PredictHQ, we ingest thousands of new events from hundreds of data sources everyday and we need them all to be perfectly accurate. Companies such as Uber, Accor Hotels and Domino’s Pizza ingest our data directly into their models, so it causes serious issues if there are errors.
Not all of our customers ingest the data directly, we also have retailers and hotel chains checking our events through our visibility platform Control Center, and they need to know that if they see an event in our system, its details are accurate and they can update their staffing, inventory or pricing plans without double checking it.
Getting a sense of how much the event matters: How big an event is can be hard to pinpoint
At the time of writing this, our systems show there are 51,954 events scheduled to take place in the United States in February 2022. If you’re seeking event data for a company with national distribution, you need to be able to identify which of these events will impact your demand, and which matter the most.
You’re not going to roster on more staff to meet the demand caused by a concert of 150 people, but you probably need to know about a concert with 1,500 people that’s around the corner from one of your locations. So how do you construct the data processes to know which events matter most? No raw event data source provides an expected attendance, which is wildly different from the venue capacity or available tickets.
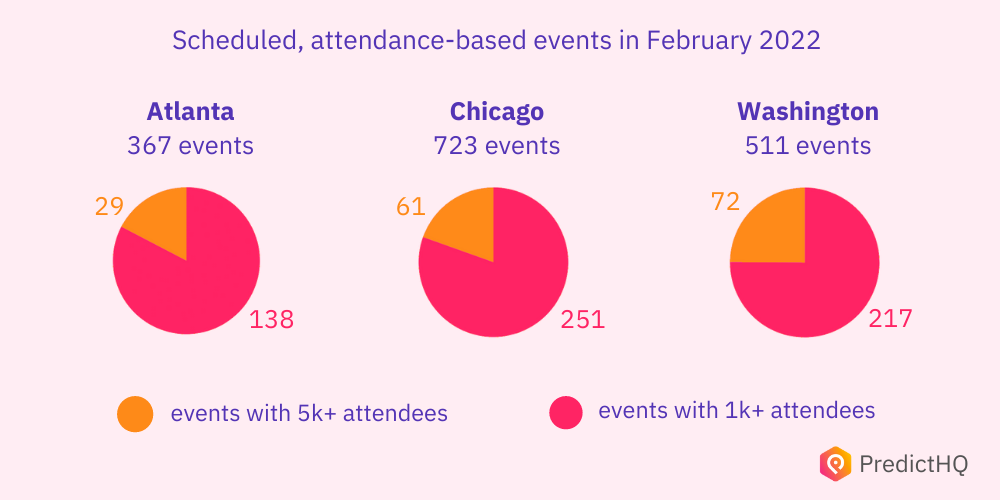
The national figure of upcoming events can be bewildering, so let’s take a closer look at upcoming impactful events in three popular US cities in February 2022:
Once you’ve identified what kinds of events impact you, you will need to identify what scale of events, or clusters of events, impact your operations for each location. To do that, you’ll need at least one of the following:
An impact ranking score per event that factors in the scale, frequency, location and population density of an event.
The predicted attendance, which works as a shortcut to know if your models or teams should pay attention and recalibrate their strategies.
The big challenge here is that even the shortcut is hard to accurately work out for each event. Many of our customers have tried to use the venue capacity or available(we tried this too, back in 2016 when we first launched), but not every event sells every seat. In fact, most don’t. In the end, we built a series of models called PHQ Attendance that factors in the venue, performers or teams, historical attendance when known, and much more to identify how many people to expect.
For example, one of the more common issues our systems identify is events that are listed with significantly more tickets or attendees than a venue can actually accommodate. Another common issue our models solve is when an event is a multi-day event, but it’s listed as separate events. This is problematic for demand planning and forecasting, as one event of 10,000 people over three days is very different to three times the volume of people over the same period.
Event size matters, but so does proximity
How physically close to your locations do different events need to be in order to influence demand? To create a large enough sample to conclusively identify these details, every single event needs to have the correct latitude and longitude. You’ll also need a depth and range of events to provide enough similar events to classify them to rank their impact.
This is especially true if for example, you run a retail or quick-service restaurant company, where you may well have multiple locations around a key venue. This is why we’ve built not just our optimal radii feature, but also our correlation engine that takes the guesswork (and weeks of data science work) out of pinpointing which events are impactful for your operations.
Tracking dynamic changes: stay up to date on cancellations, postponements + attendance changes
If you’ve made it this far in the process, you must be committed. Many of our customers (including some of the leading brands and biggest technical teams in the world) realized how challenging a data set demand intelligence is, and signed up with PredictHQ so they could get back to focusing those hundreds or thousands of hours on their core business.
One of the big lessons over the pandemic era is you need a detailed scalable way to constantly re-verify and update events as they change. Everyone working with event data probably underestimated this task prior to 2020 and beyond, including us. We were lucky that we had built a series of re-verification models that could keep track of the chaos unleashed by the pandemic.
While it is a lot calmer these days, events will always be a highly dynamic data source, with some of the most common event changes including:
New additions to event line-ups that drive up demand and therefore, attendance
Increases in available tickets for sale, and/or add-on events
Location changes
Date and time changes, especially for events uploaded by the public that may appear across multiple event platforms, with inconsistent event details
Postponements, reduced attendance, or cancellations due to health ordinances
Prior to the pandemic, between 1% to 3% of the tens of thousands of events each month were canceled or postponed. Particularly in these more dynamic times, demand planning and forecasting teams are frequently being caught off guard by changes to events they believed they were ready for, only to find the event had changed.
To put the above three steps in context, this post dives into the most common issues and the machine learning models we have to build to identify the range of issues that can occur, and fix them at scale.
Standardization: Ingest event data from different sources in a uniform format for quick, painless processing
Once you have all of the above data, a critical step is standardizing it. If you are ingesting the data into your machine learning models, or integrating it with your existing business intelligence tools such as Tableau, you will need your data to have a uniform structure so these programs can process it.
If you’re organizing a list or plotting them on a heat map for your team, standardization is still required to ensure it’s consistent and easy to understand. A school holiday has a start and end time, as well as a volume of people it impacts directly, but its impact on operations is more diffuse than say, a festival for example.
Let’s say you’re going for what you hope is minimal viable event coverage: sports, expos, festivals and school holidays. By cobbling together a few of the more expensive specialist API and other tactics for gathering the more complex and varied events (school holiday dates vary substantially by district in the US and UK, for example), you will likely have at least four different event formats, but probably more as expos and festivals require multiple sources each to get close to thorough coverage.
Making event data easy, efficient, and effective to use
How much time should you expect to spend attempting the steps outlined above? We’ve skipped over the nitty gritty details of each phase for time’s sake— but actually implementing these steps will depend mostly on how many engineers and data scientists you can commit to the experiment.
One of our customers– who happens to be one of the world’s largest accommodation providers– had a team of four technical staff working tediously on these steps for over six months before finally deciding to explore external options for event-based data. Before signing up with PredictHQ, they were able to identify impactful events, but they didn’t have the demand intelligence needed to reduce their forecasting error, or to ensure they were optimizing pricing in response to events before most of their in-demand rooms were already booked.
Another customer, this time in the transport space, had tasked a team of two who had been experimenting with prototypes for more than a year without making much headway.
Regardless of if you are successful in gathering the data, the final step is critically important: making it user-friendly so your team will act on the insights they get from this demand intelligence.
Depending on who’s responsible for demand planning or forecasting at your organization, as well as who’s responsible for the function you are looking to improve such as staffing, pricing or inventory, you’ll need different deliverable versions. Speaking again to my own experience, users fall into roughly one of three categories:
Visibility: empower your end users such as hotel managers, store or area managers, driver partners or revenue managers to know about impactful events so they can decide what action to take in response, or to better trust and respond to directions from head office. As the pandemic blew demand patterns to pieces, this is increasingly being viewed as a must-have source of insight.
Integration: factor events into existing business intelligence platforms and processes to make your planning or forecasting real-world aware. This is a low-code solution that ensures you are tapping into more of the impact of events, and is more feasible for organizations with more than five locations as it can help automate smarter decision making. This is our fastest growing approach to using our enriched and verified event data.
Machine-learning forecasting: ingest demand intelligence directly into your relevant machine learning models for better informed and more accurate forecasting at scale.
Regardless of whichever option you need, you’ll need to test your solution and keep refining it based on your teams’ feedback.
The above is only the most basic skeleton of the many challenges in sourcing, verifying and enriching high quality event data. There are many extra hurdles, and our team of ~30 data scientists, analysts and engineers have been working on nothing but this for four years, and we’re still discovering new ways to make our data more and more useful.
If you are considering sourcing event data, it’s worth reaching out to our team to try our demand intelligence early in the process, to see what forecast-grade event data can reveal about your demand drivers, and the huge variety of opportunities out there just waiting for your team to discover and go after them.


